Harald Kliems
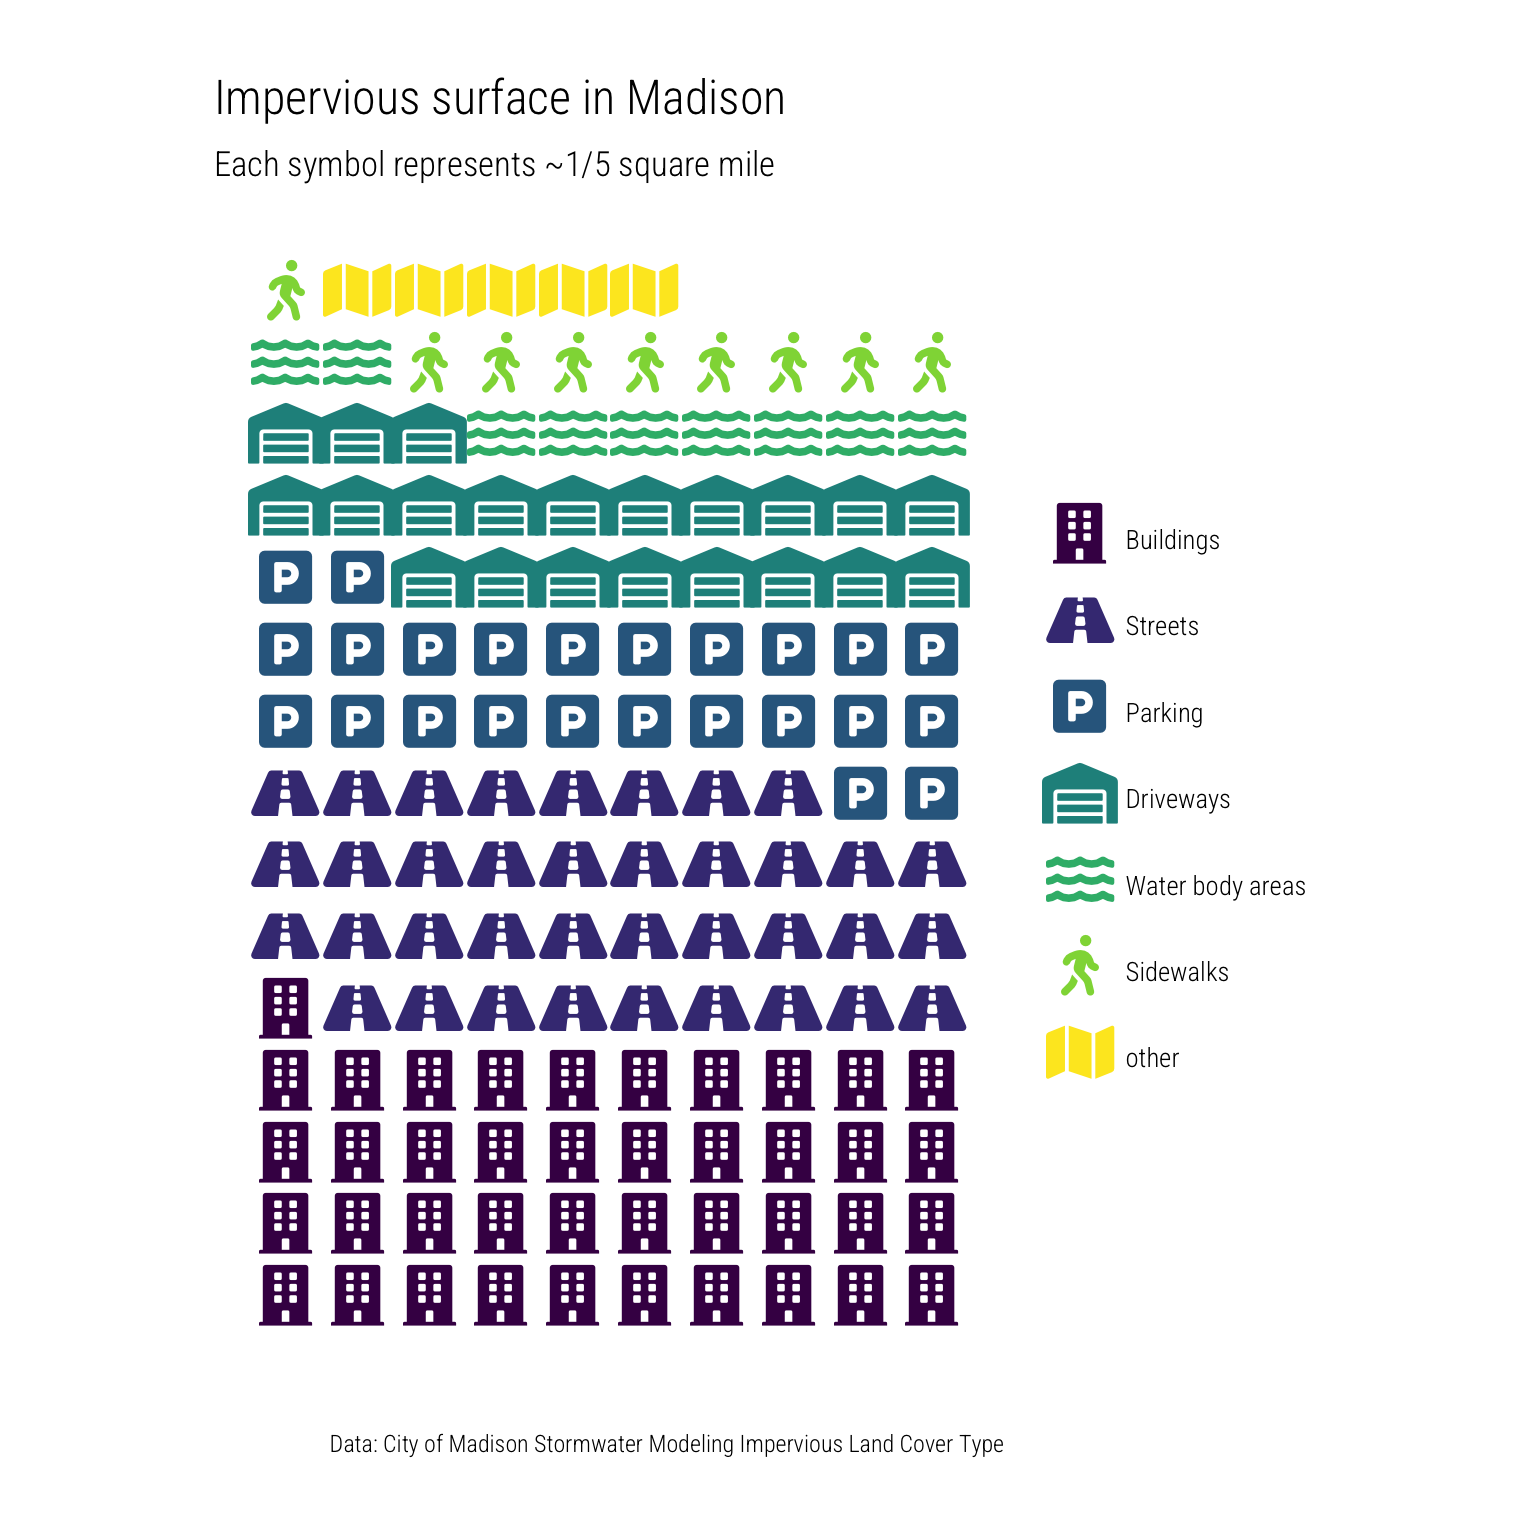
Impervious areas in Madison
Data viz with waffle charts, or not
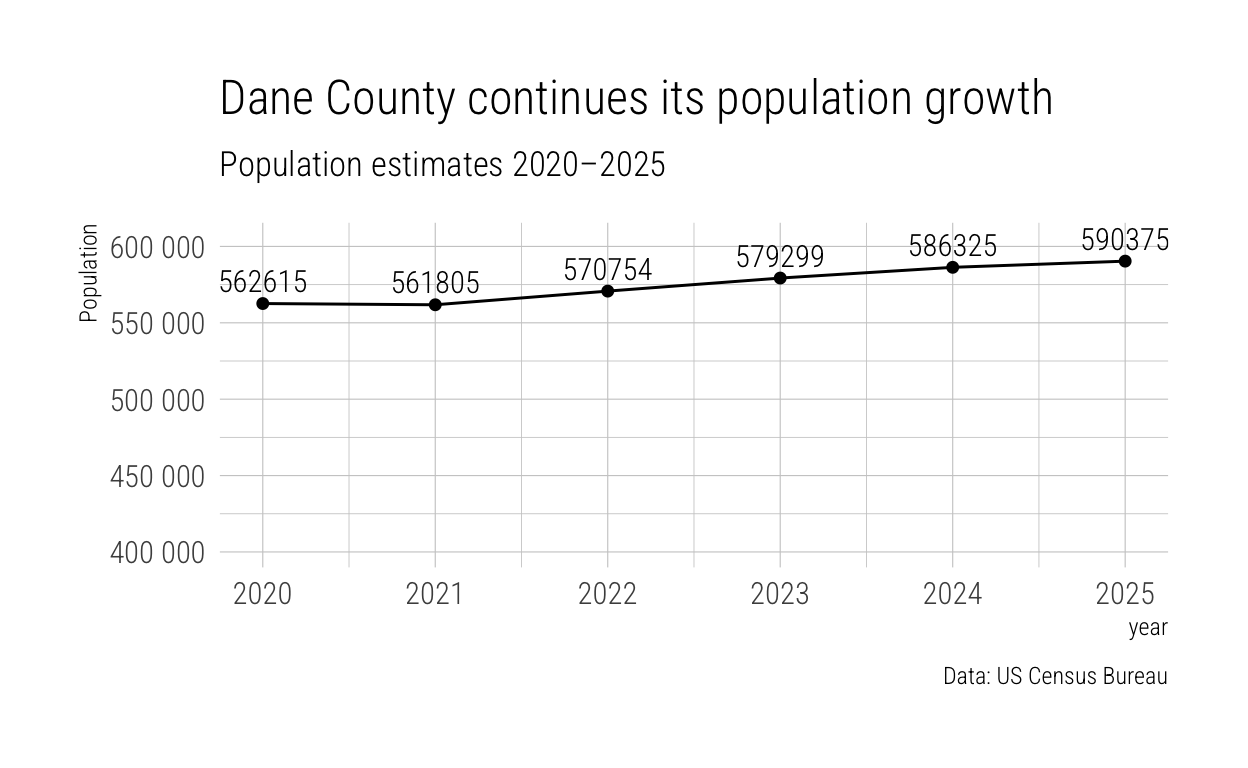
Some Wisconsin County Level Population Data
The 2025 Census Bureau Population Estimates are out
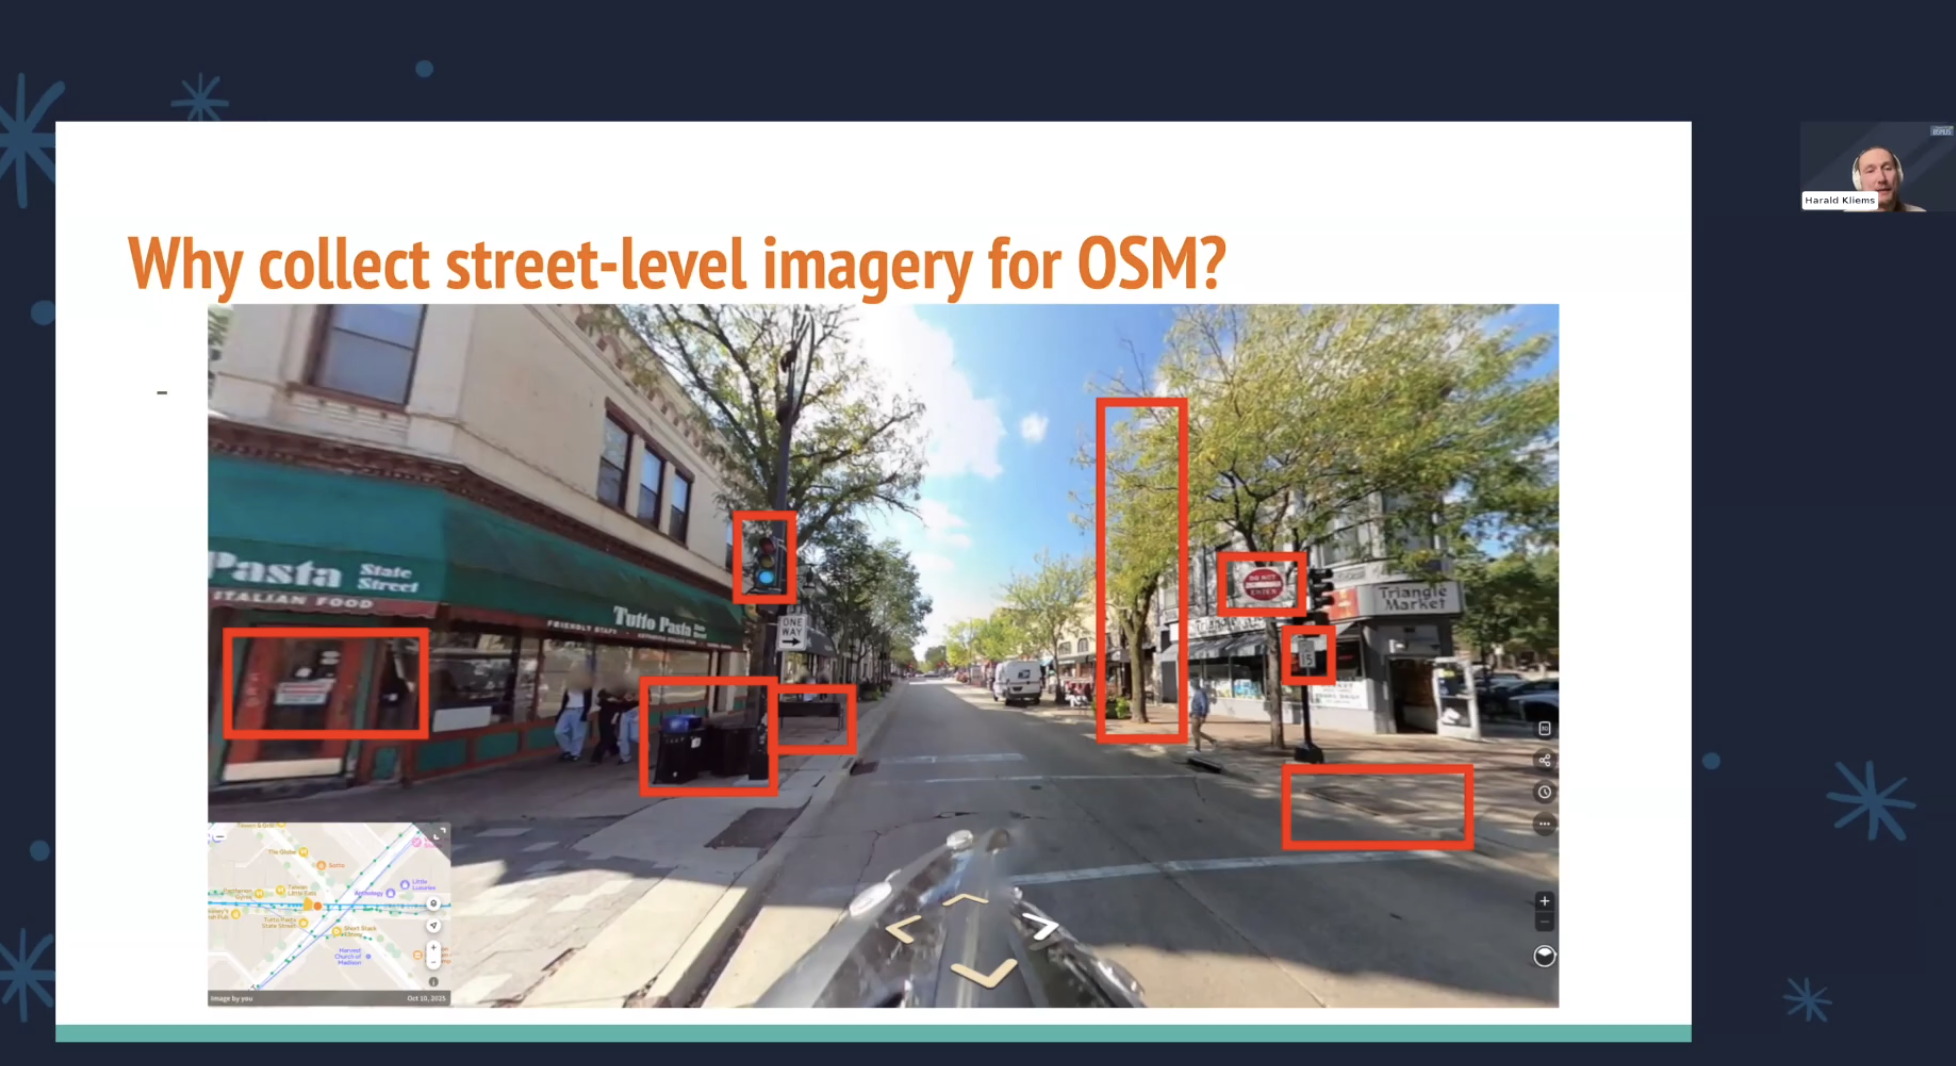
Street level imagery and OpenStreetMap
I gave a talk at Mapping USA 2026
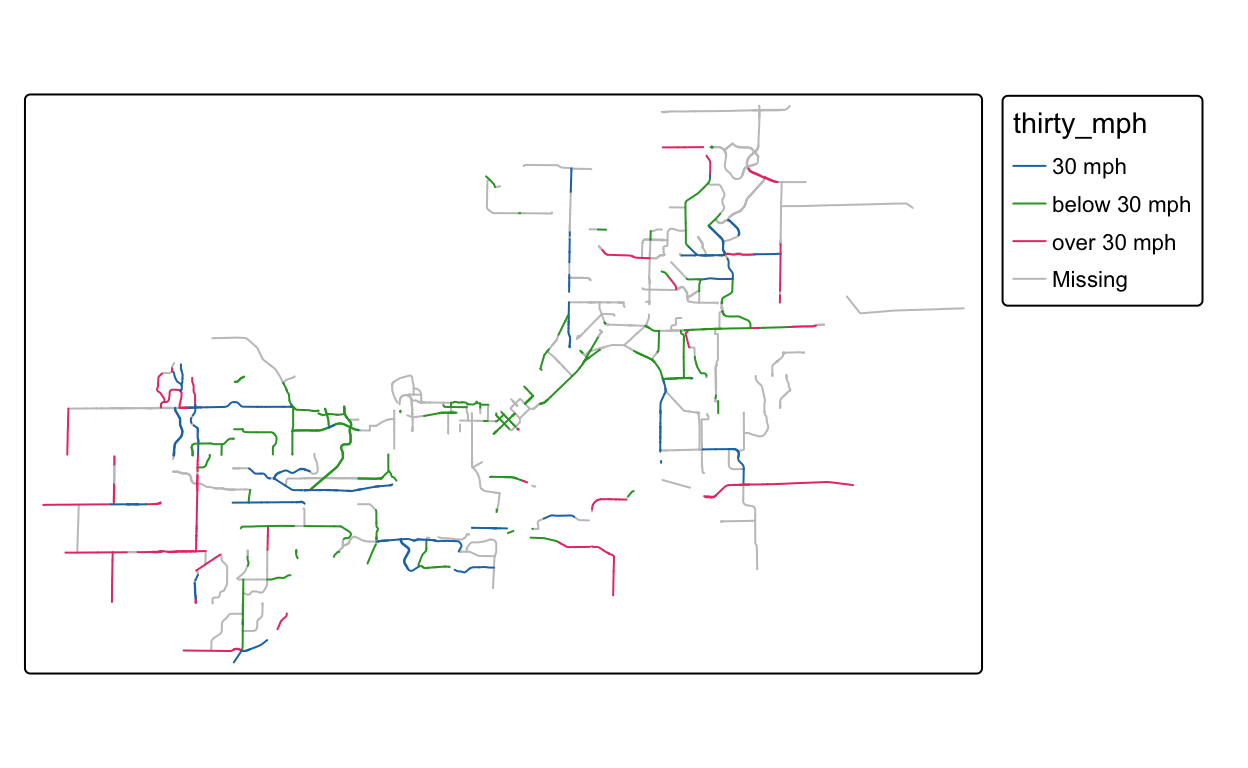
Speed limits on tertiary highways and traffic stress
A look at OpenStreetMap data in Madison and Milwaukee
Travel times on Willy Street, Part 2
Another look at travel time estimates, now including the JND construction
#30 Day Map Challenge: Points
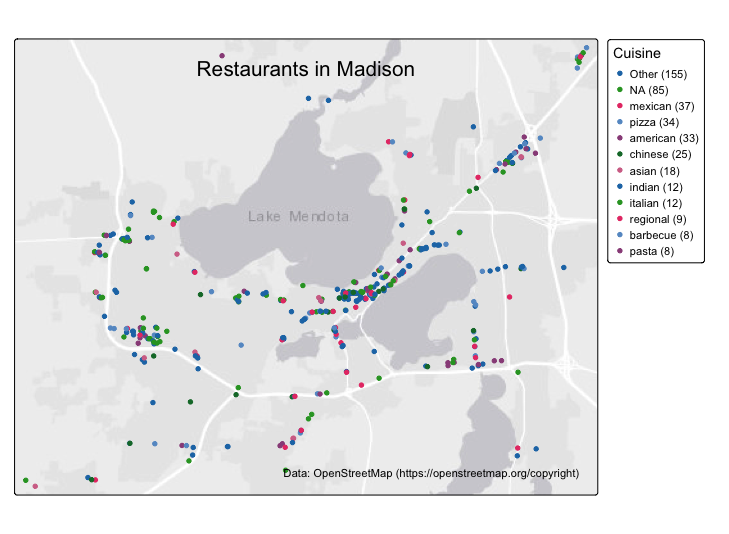
Madison restaurants and their cuisine
Travel times on Willy Street
A preliminary look at the data during the rush hour lane closure trial
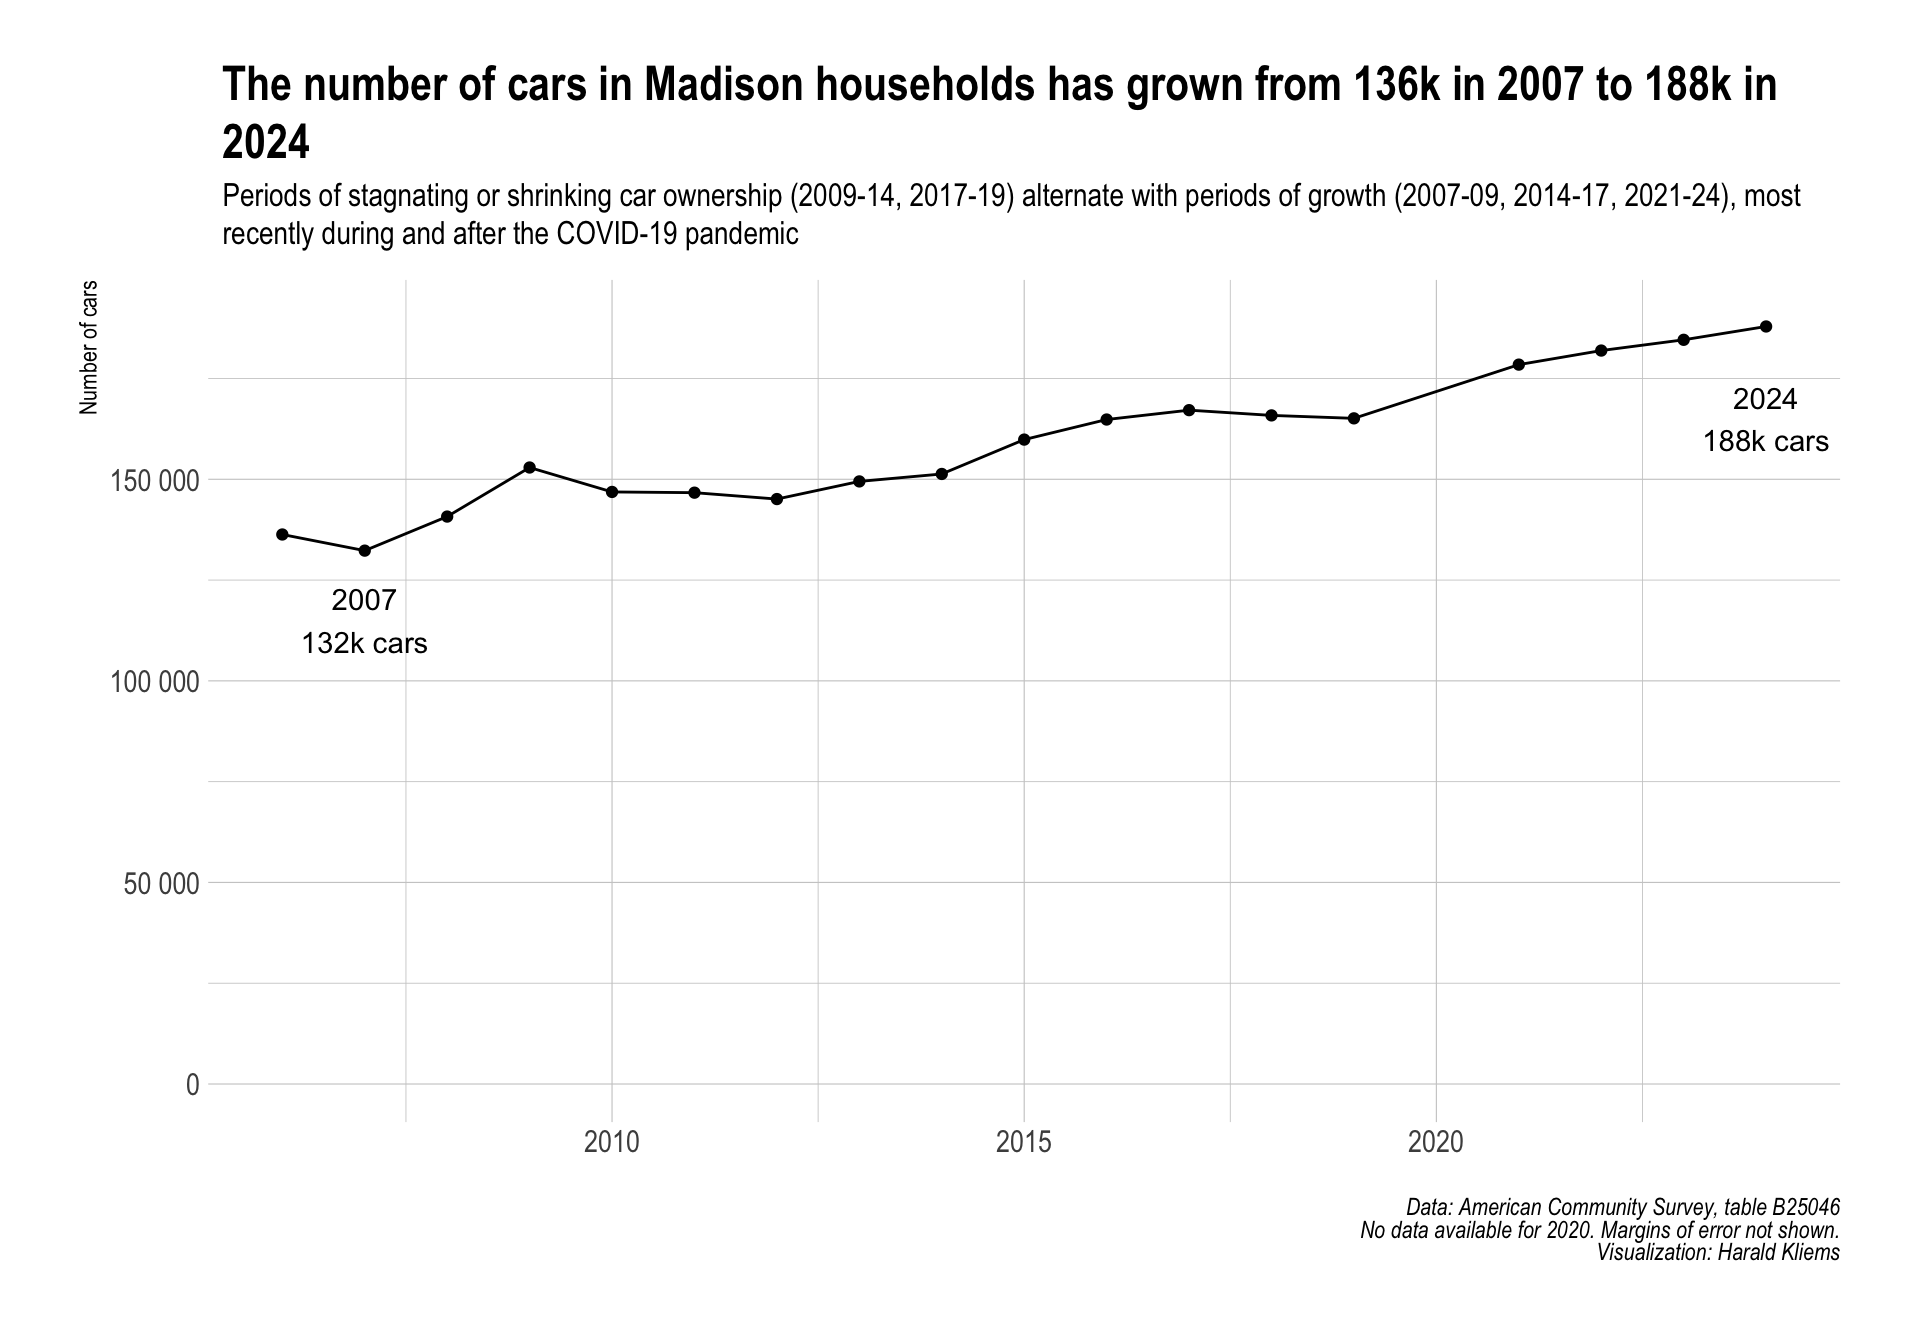
How many cars are there in Madison?
Using American Community Survey data to look at car ownership in Madison over time.
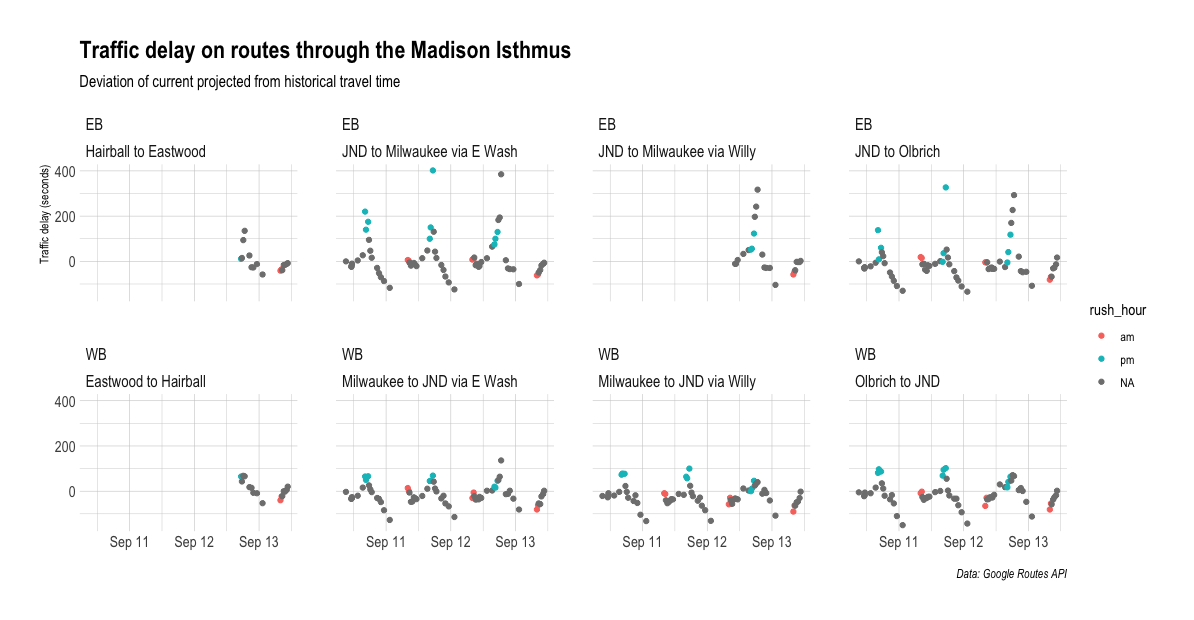
What happens when you remove rush-hour travel lanes?
Using the Google Maps API to collect travel time data during a traffic trial
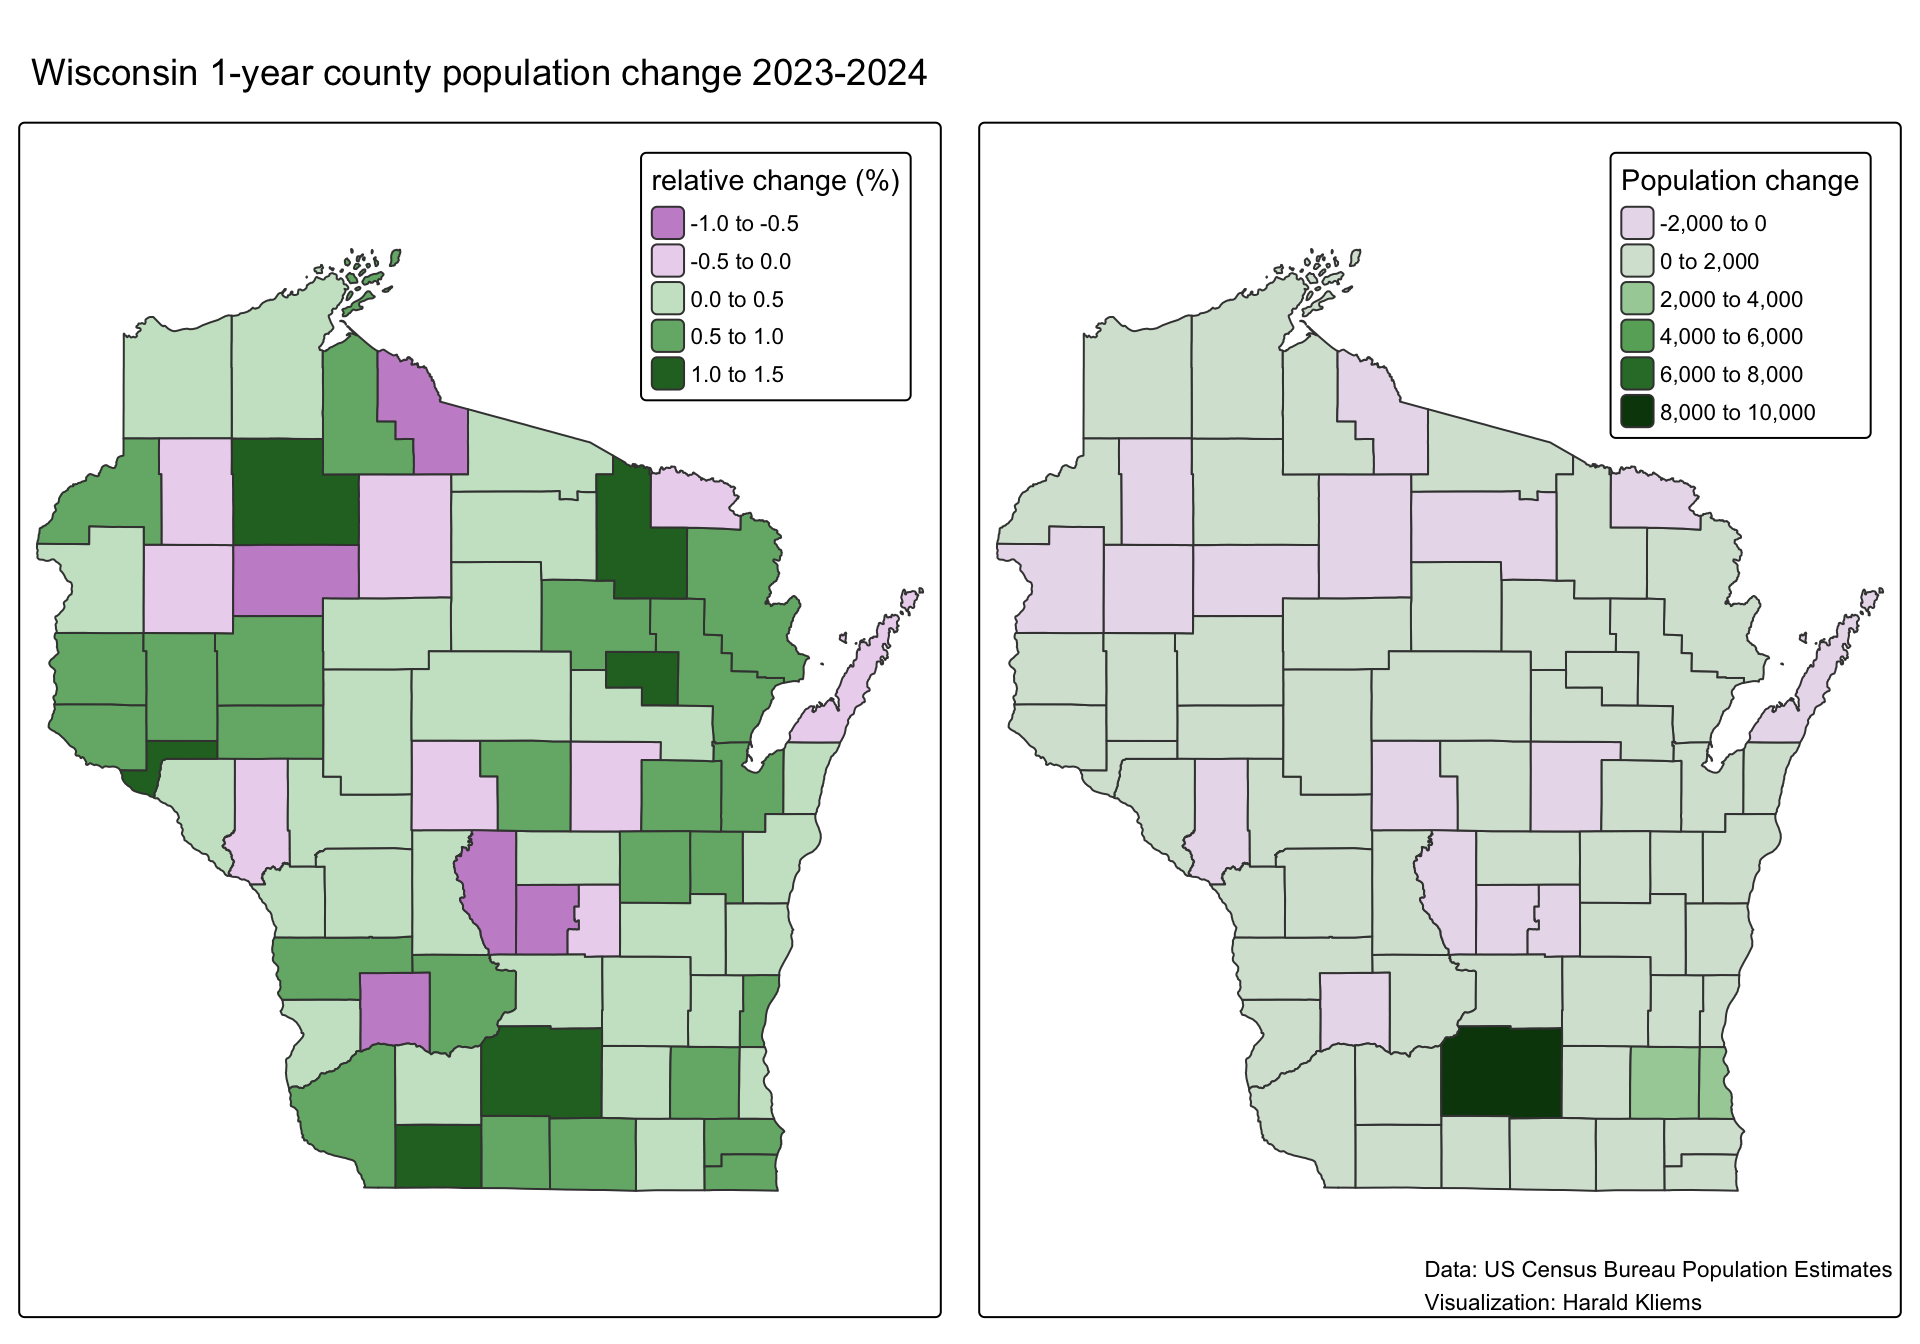
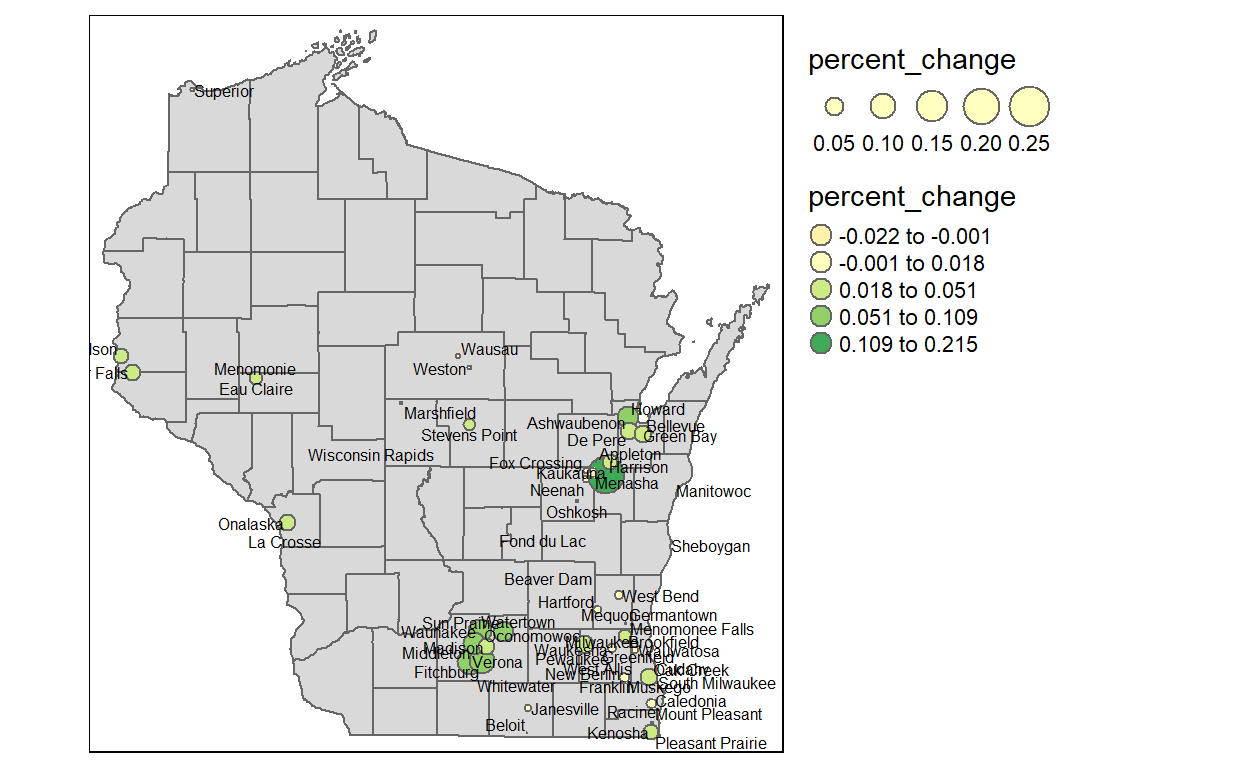
County-level population change in Wisconsin
Which counties have gained the most population between 2020 and 2024? Which ones shrunk?

A 3D map of downtown Madison
Using digital surface model data and `rayshader` to create a detailed rendering
#30DayMapChallenge: A boring points map
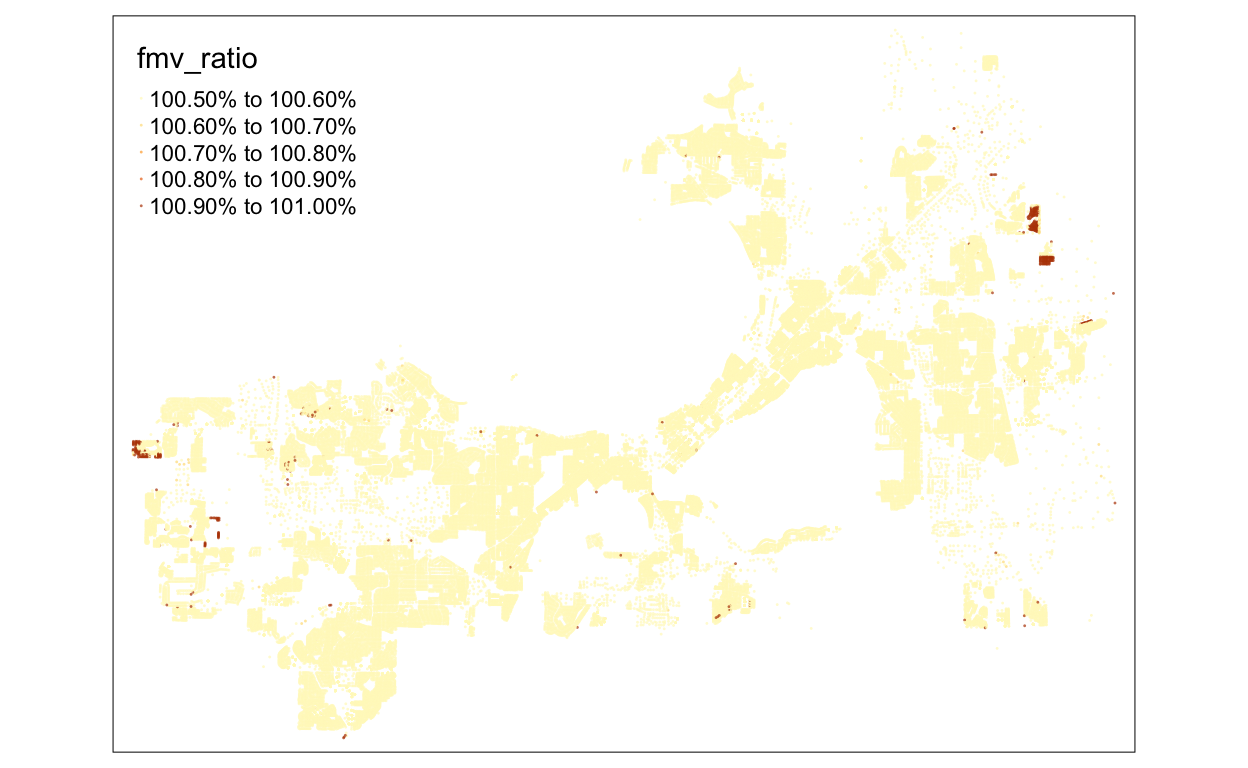
Comparing fair market and assessed value in Madison
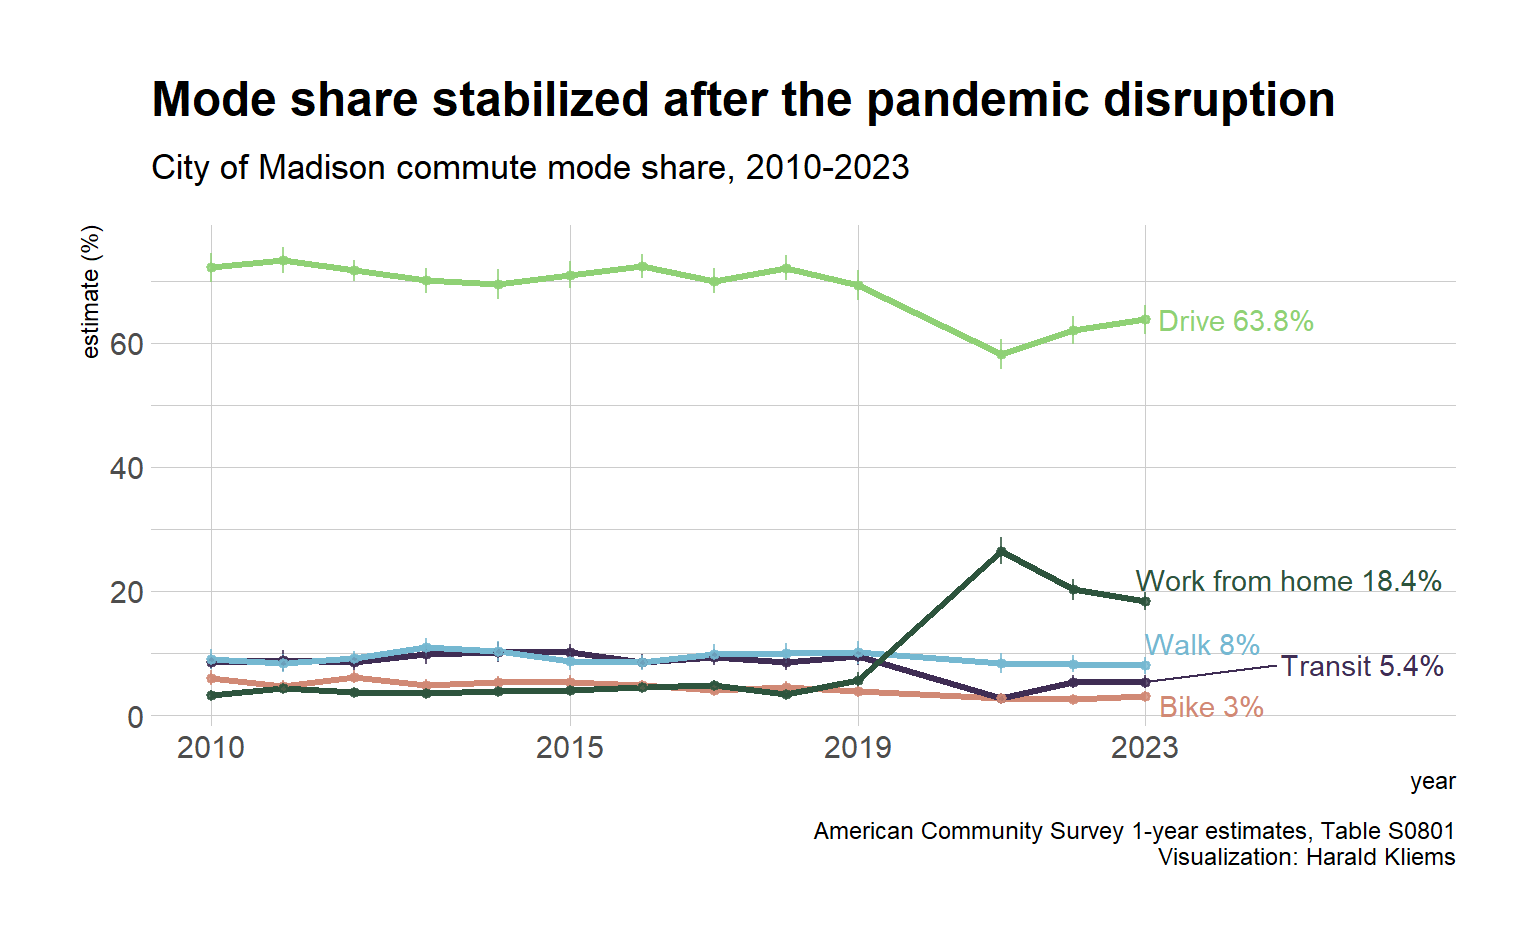
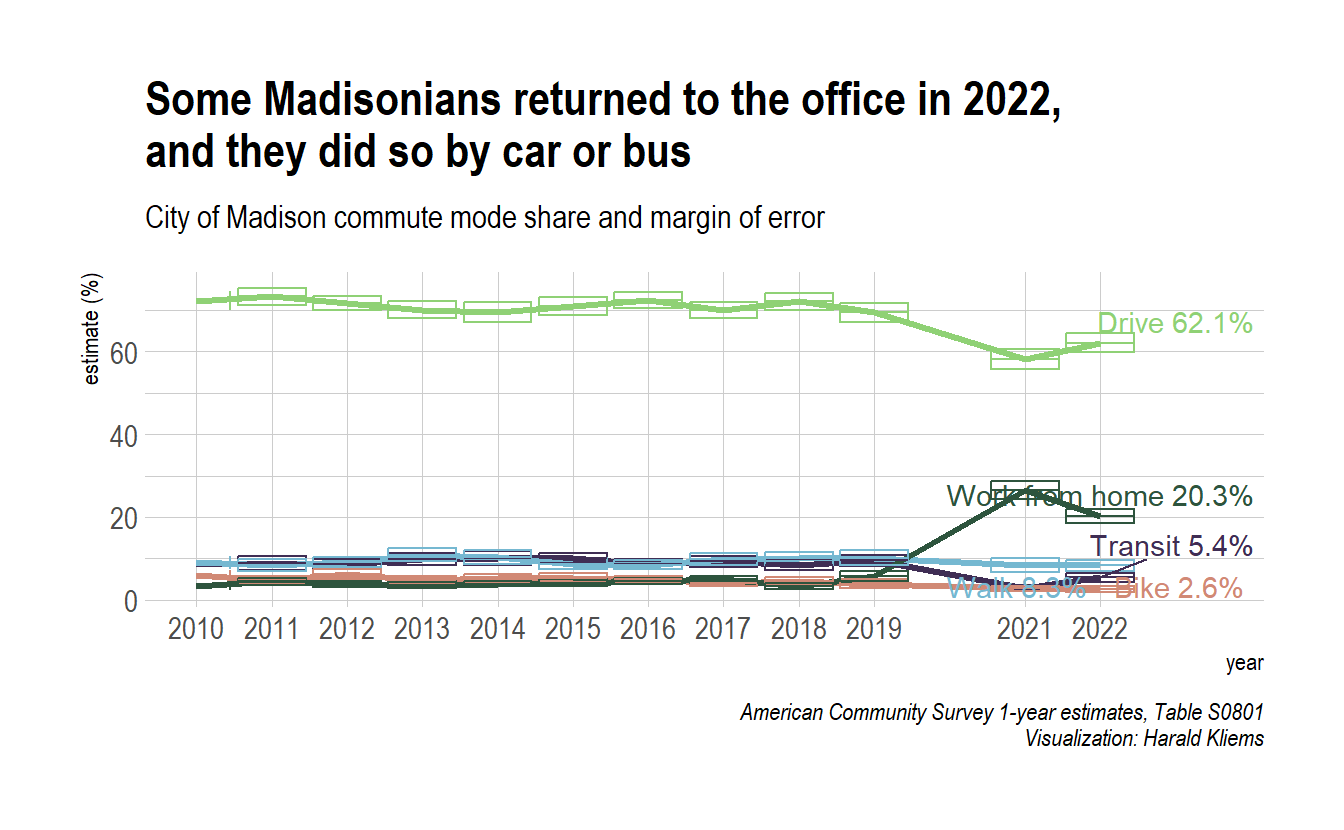
Nothing new on mode share in Madison in 2023
American Community Survey one-year estimates show commute mode share remains stable
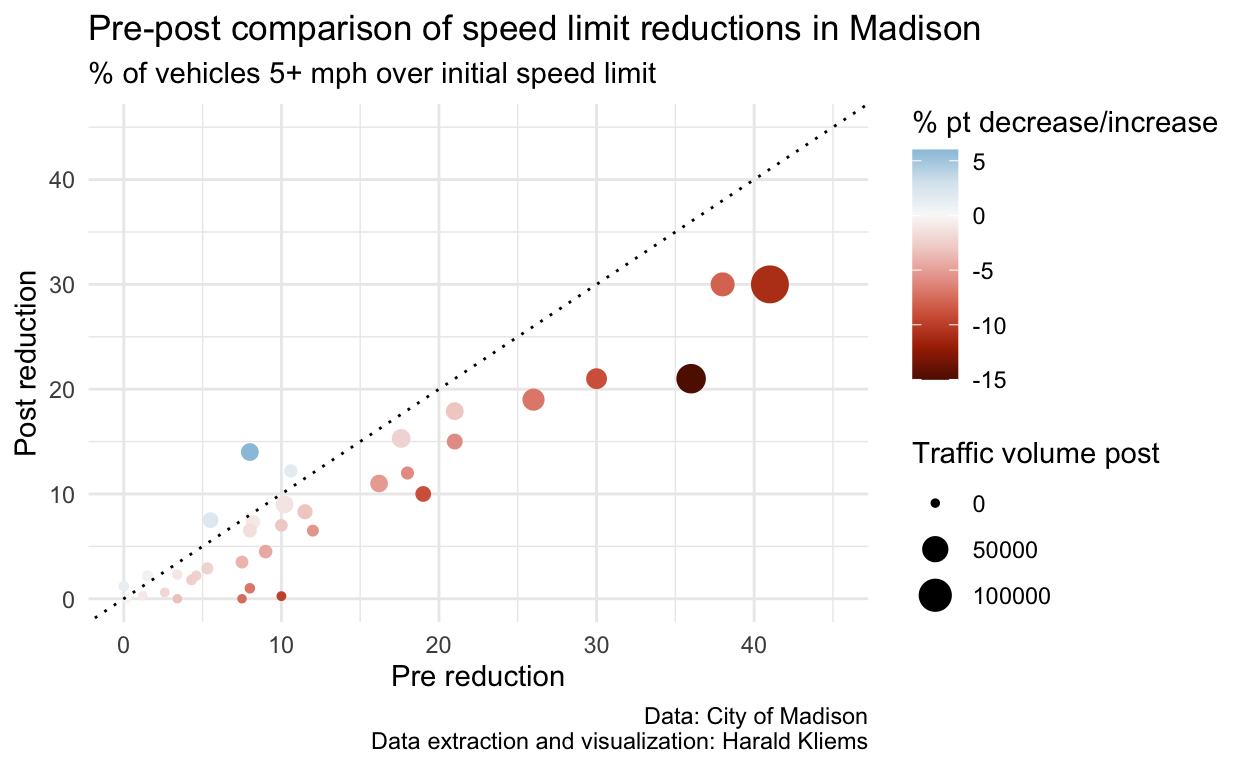
Do speed limit reductions reduce speeds?
Comparing pre-post data in Madison, Wisconsin
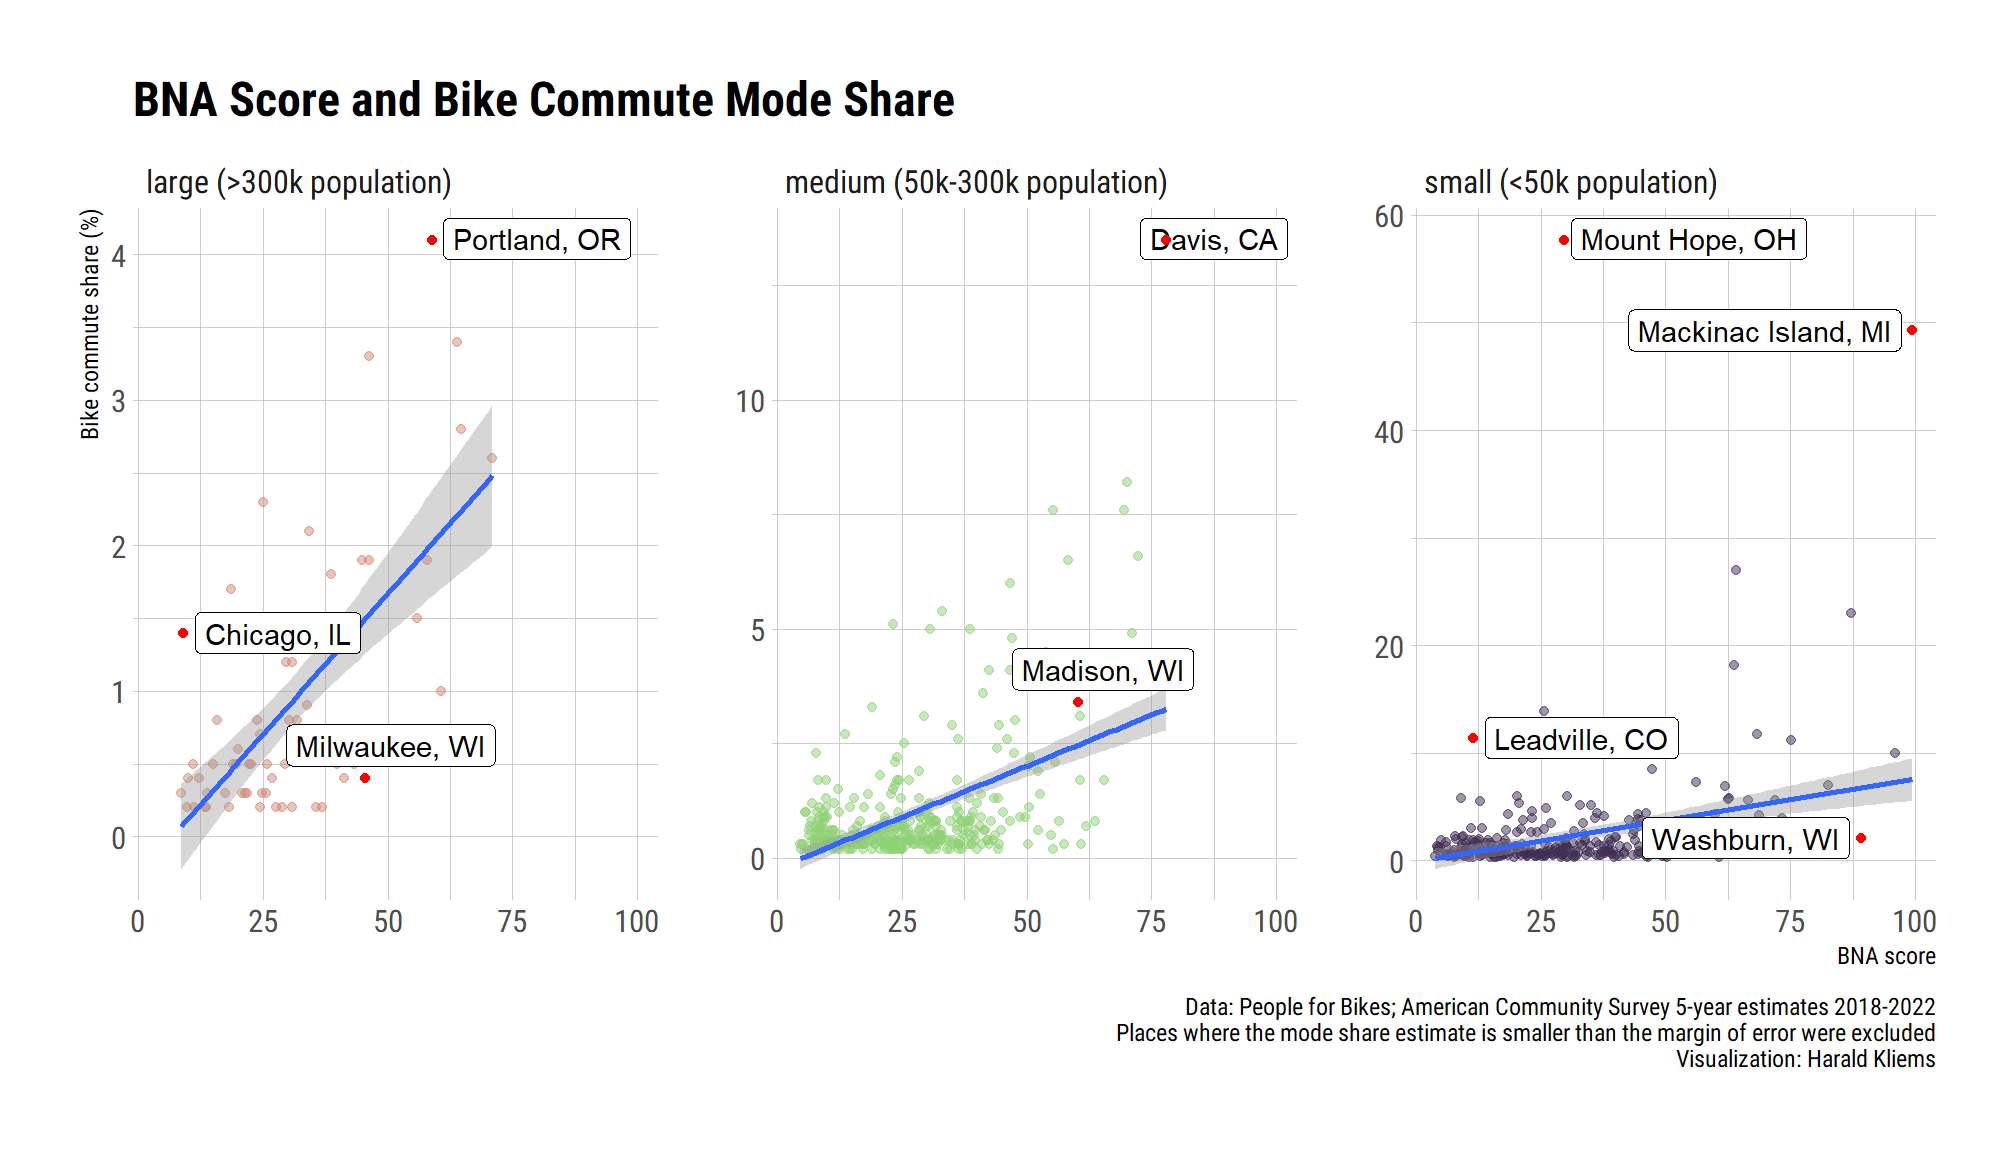
Bicycle Network Analysis and Bicycle Commute Mode Share
Do better bike networks lead to more bike commuters?
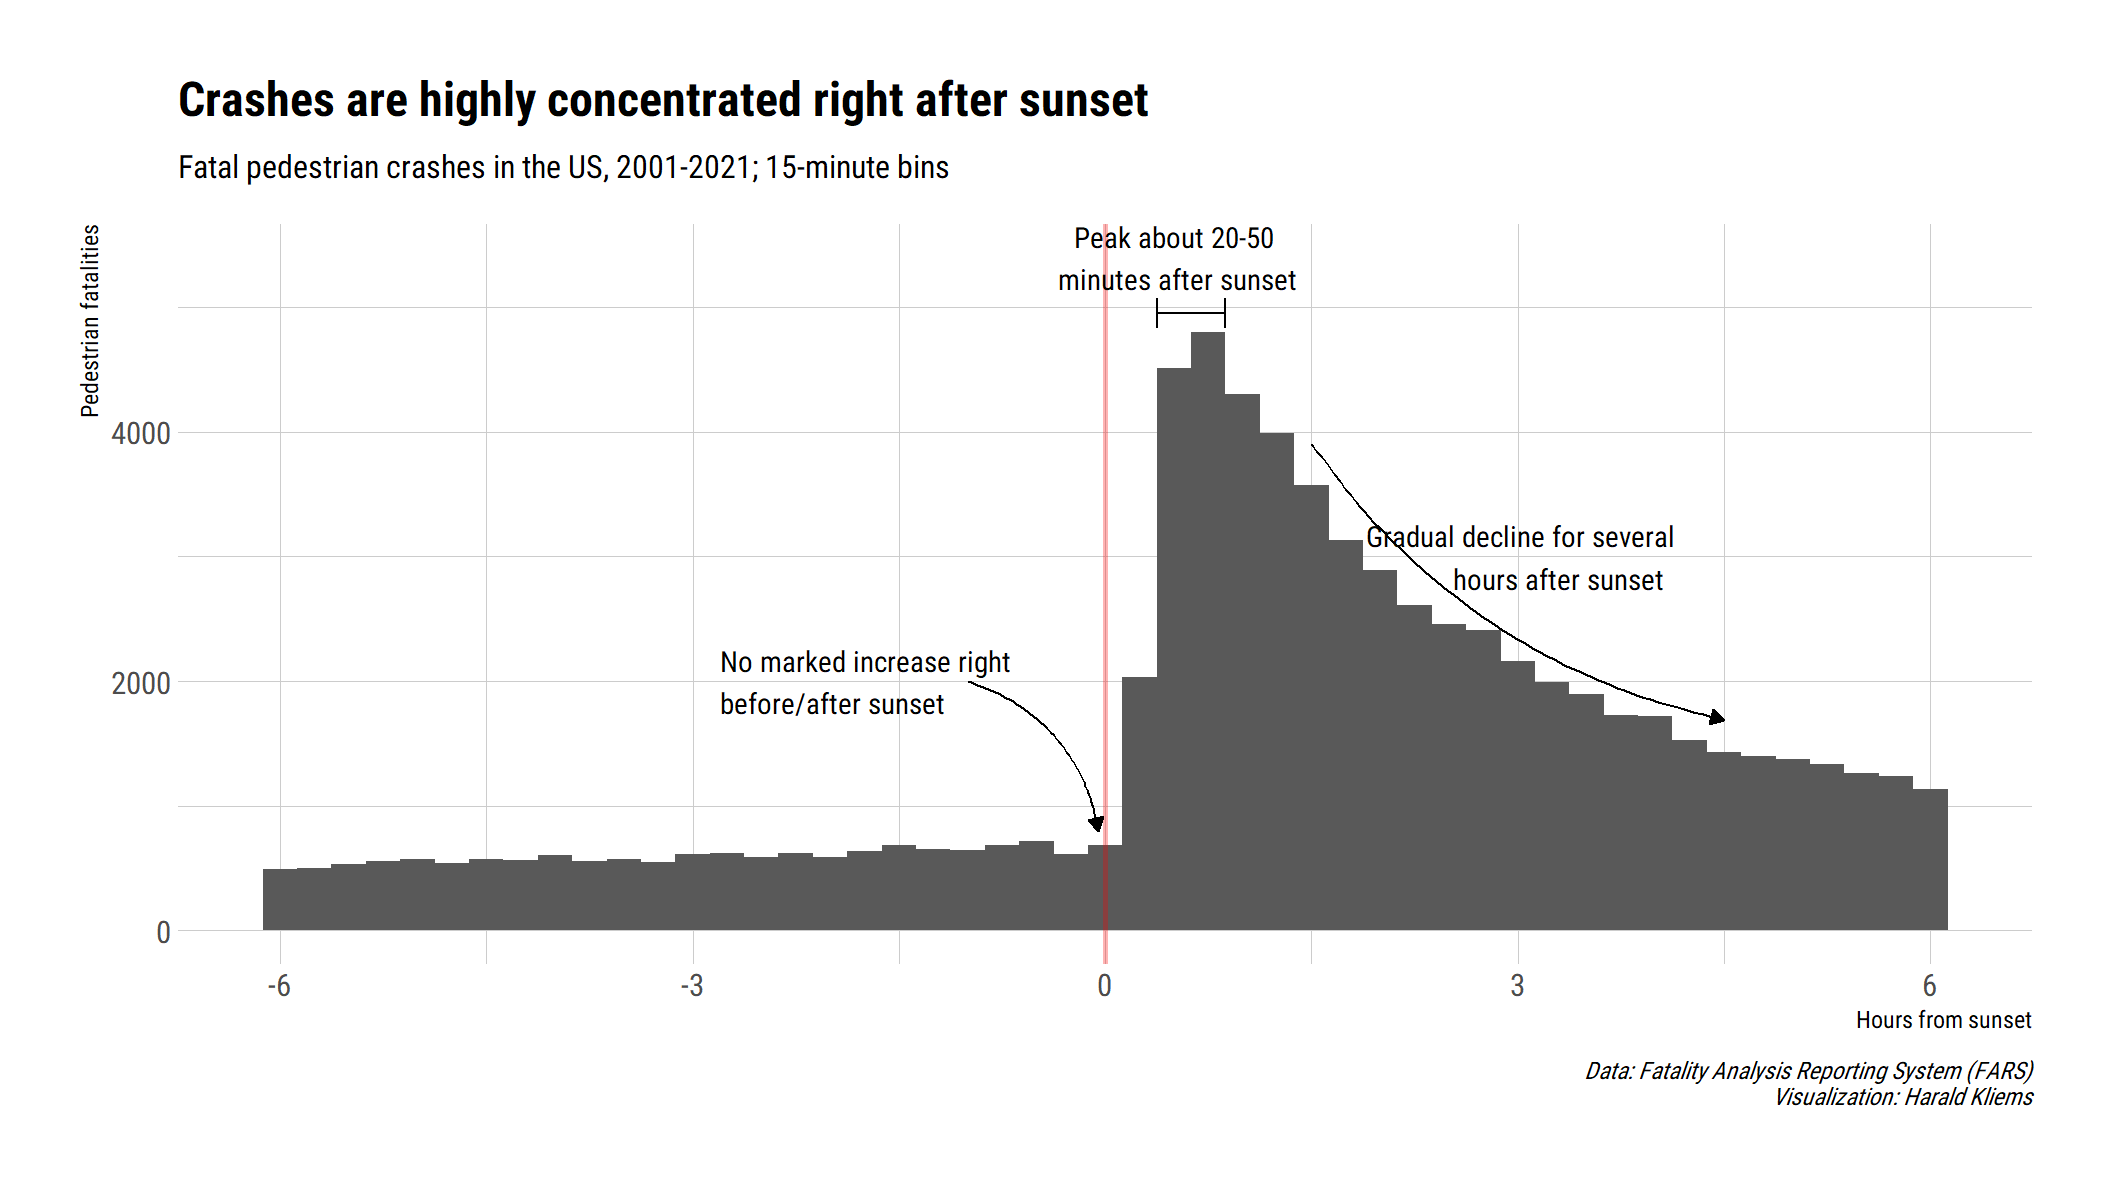
After the sun sets, pedestrian fatalities spike
Pedestrian fatality data from 2001-2021 and how the time of fatal crashes varies over the day
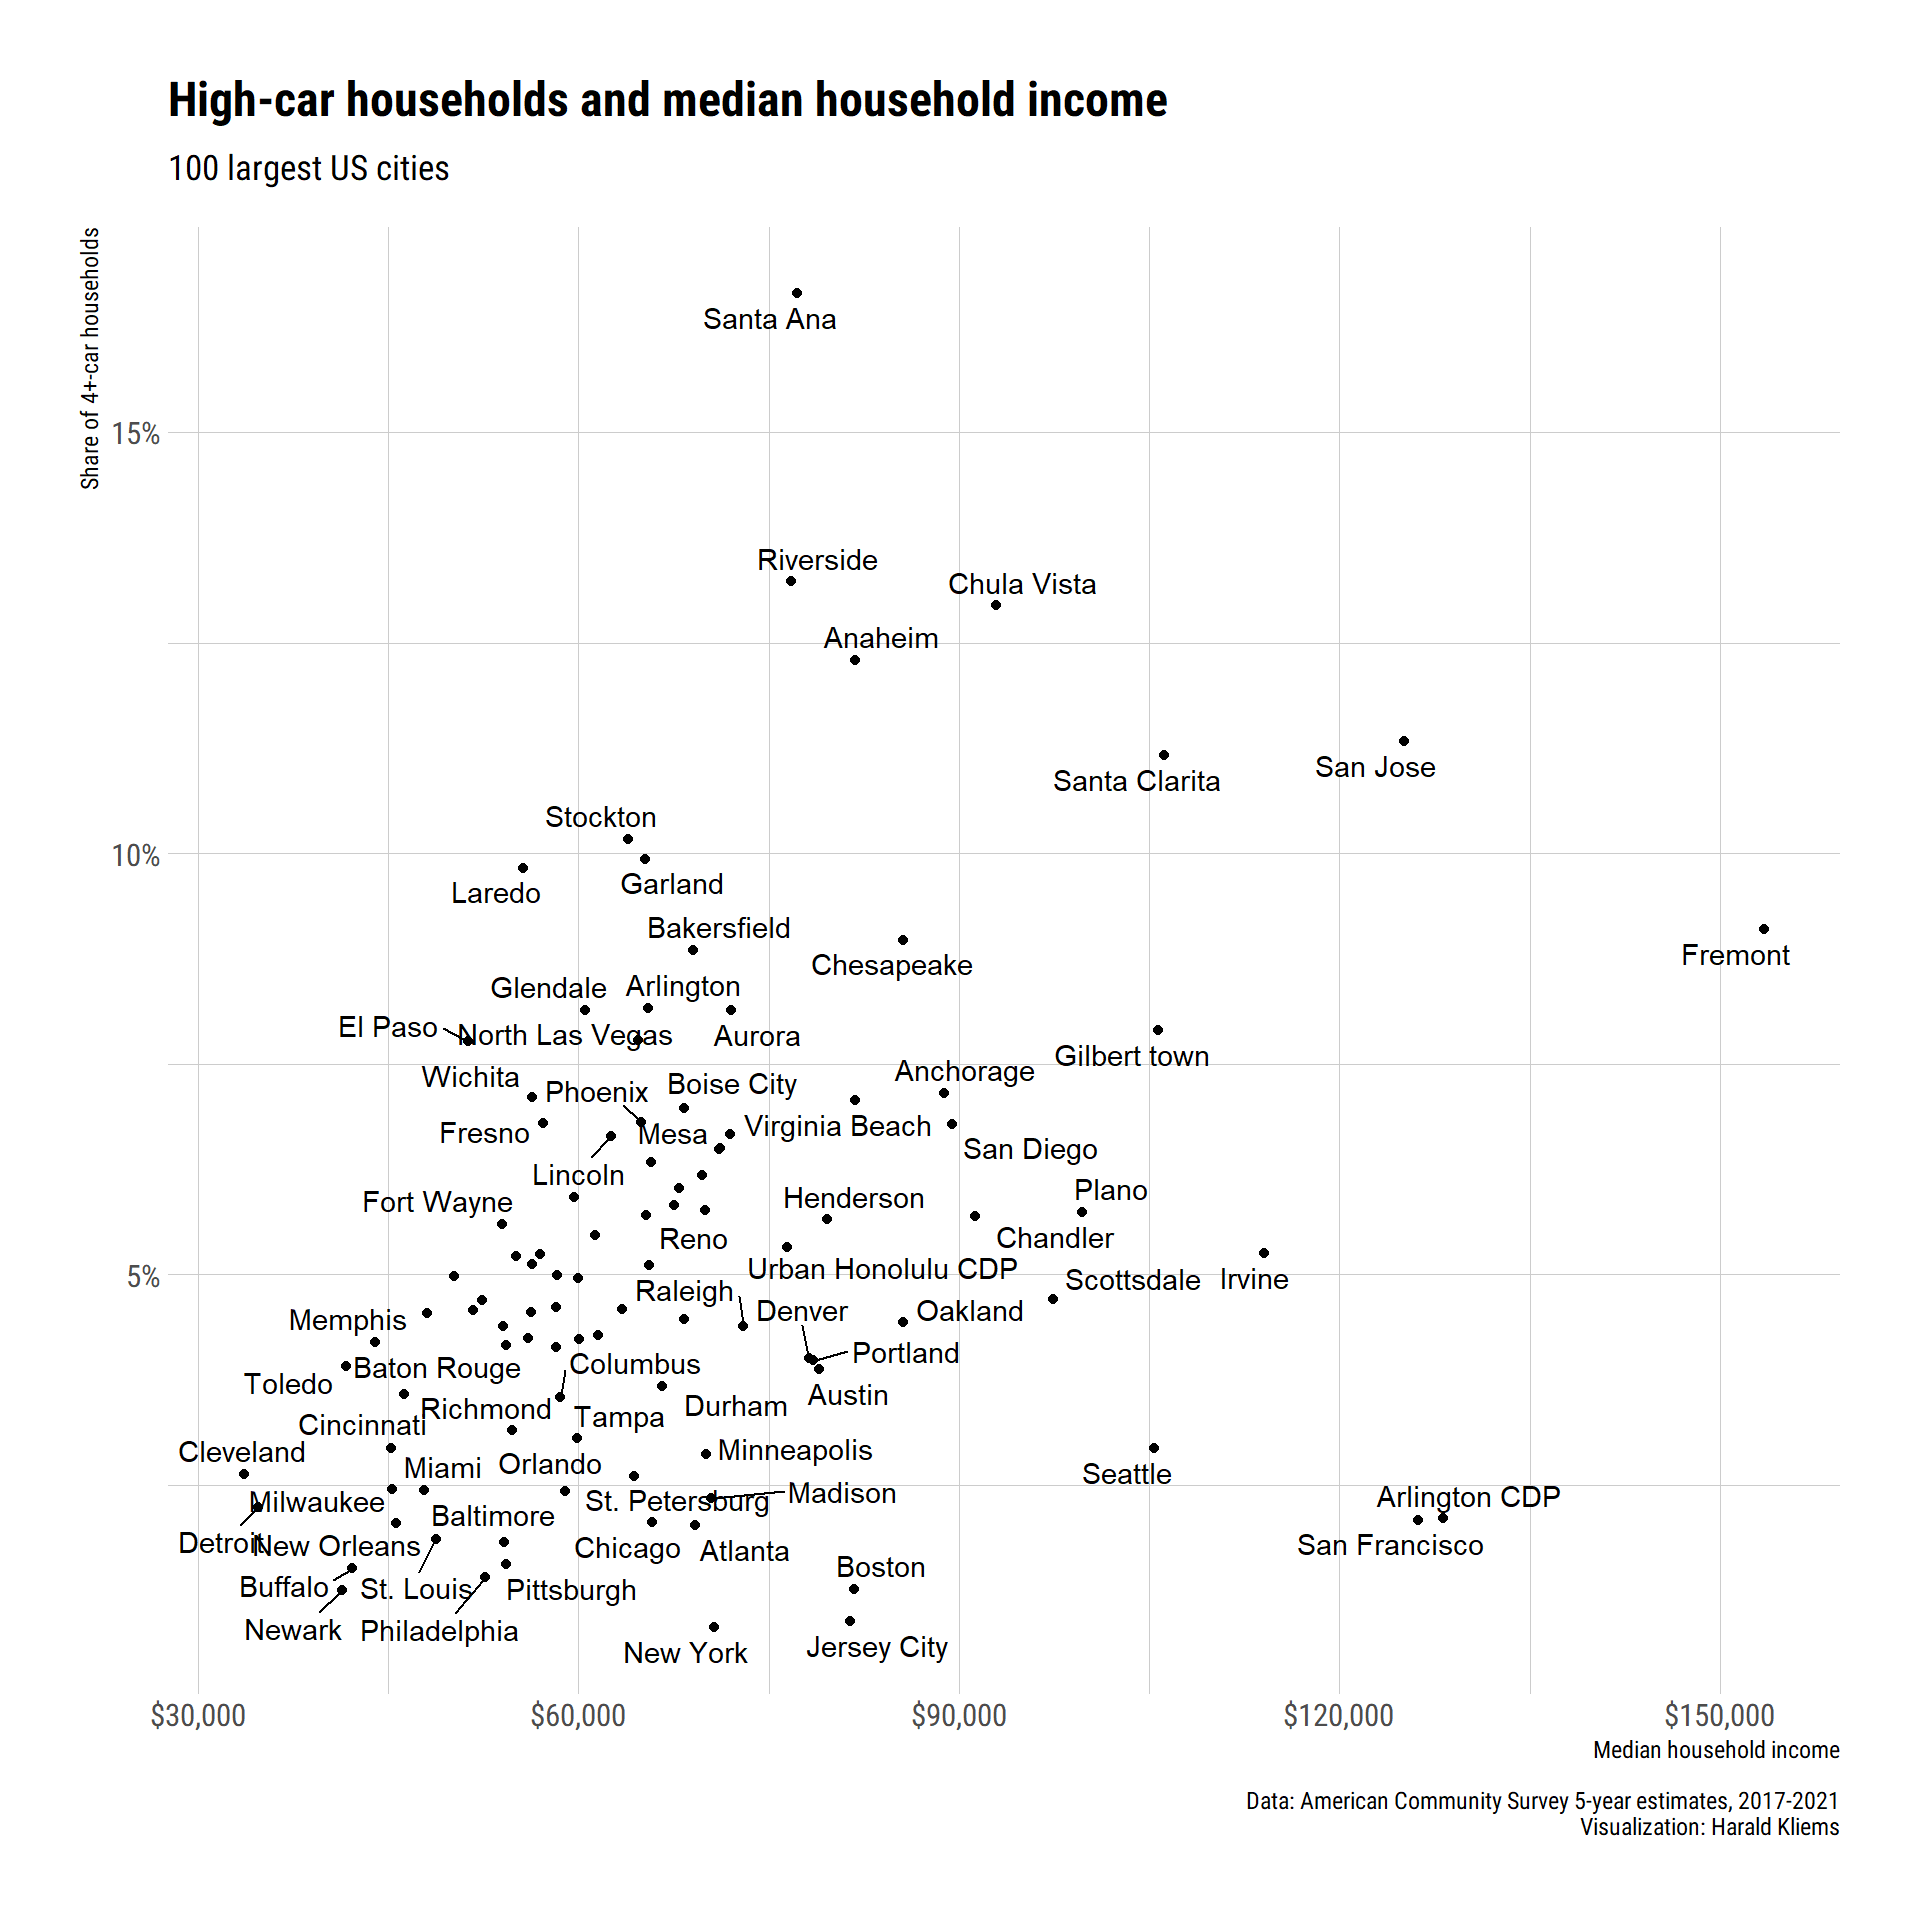
Where are the 4+-car households?
A quick look at households with 4 cars or more.
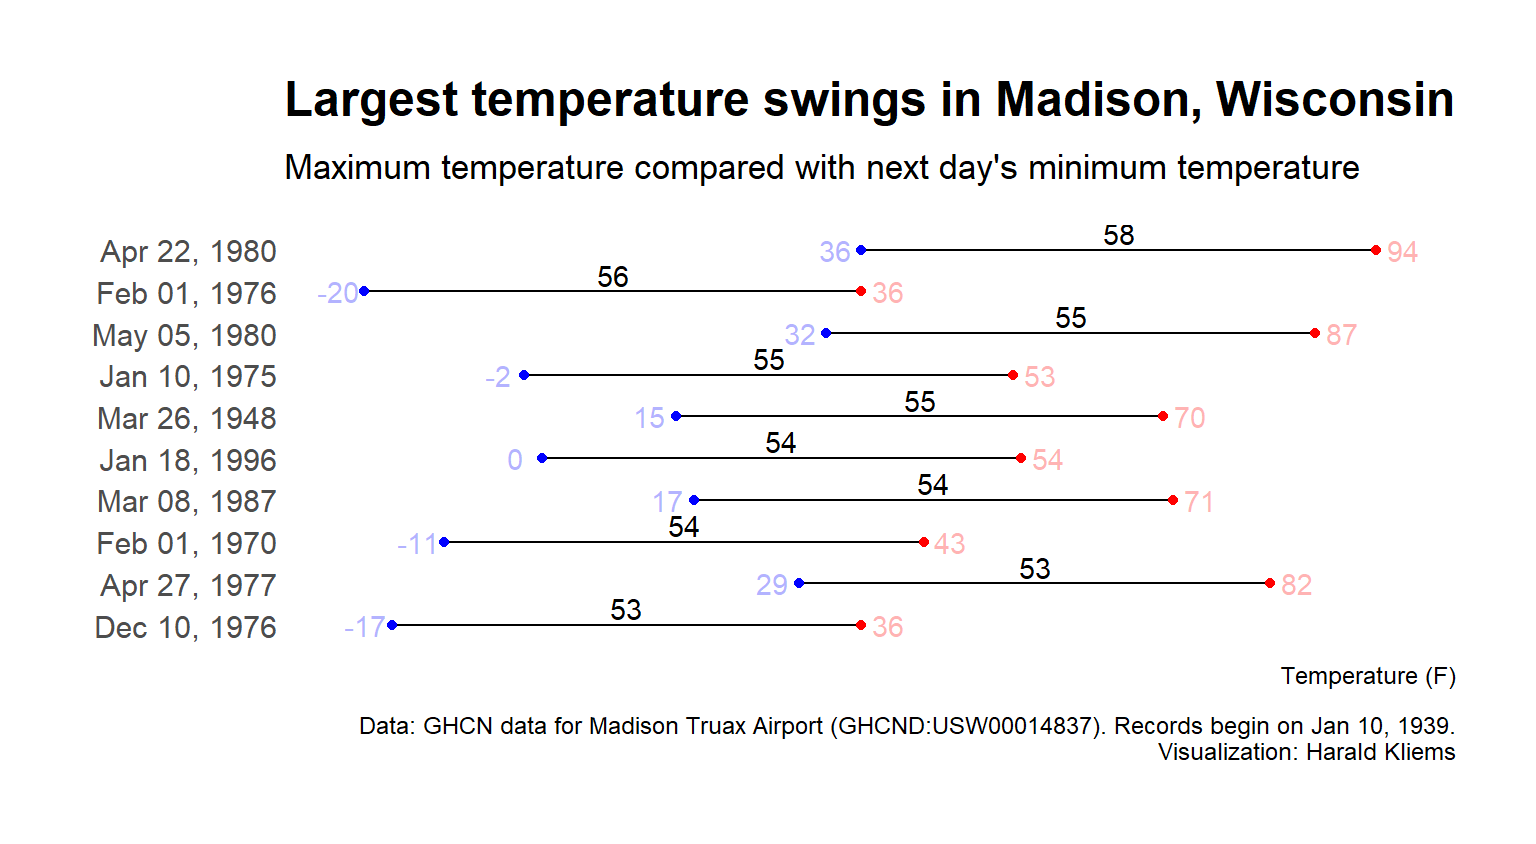
Madison's largest temperature swings
From 67 to 15 F overnight??
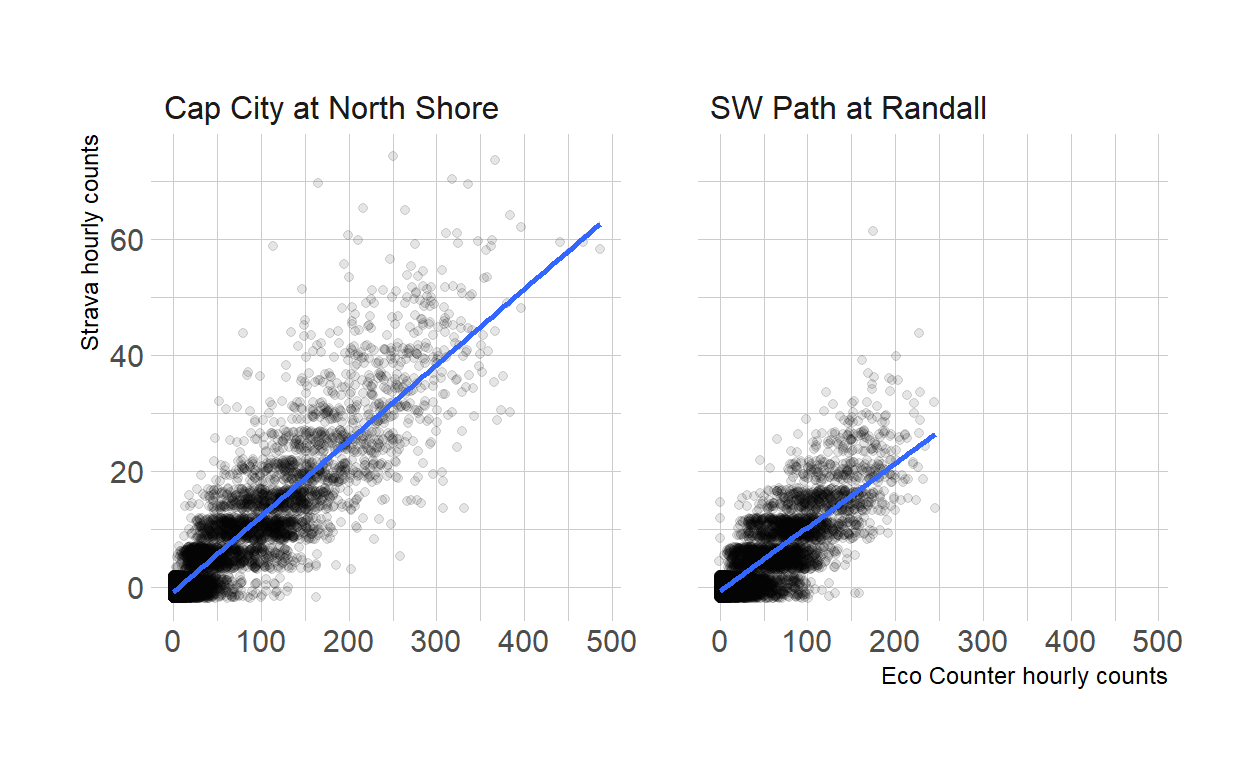
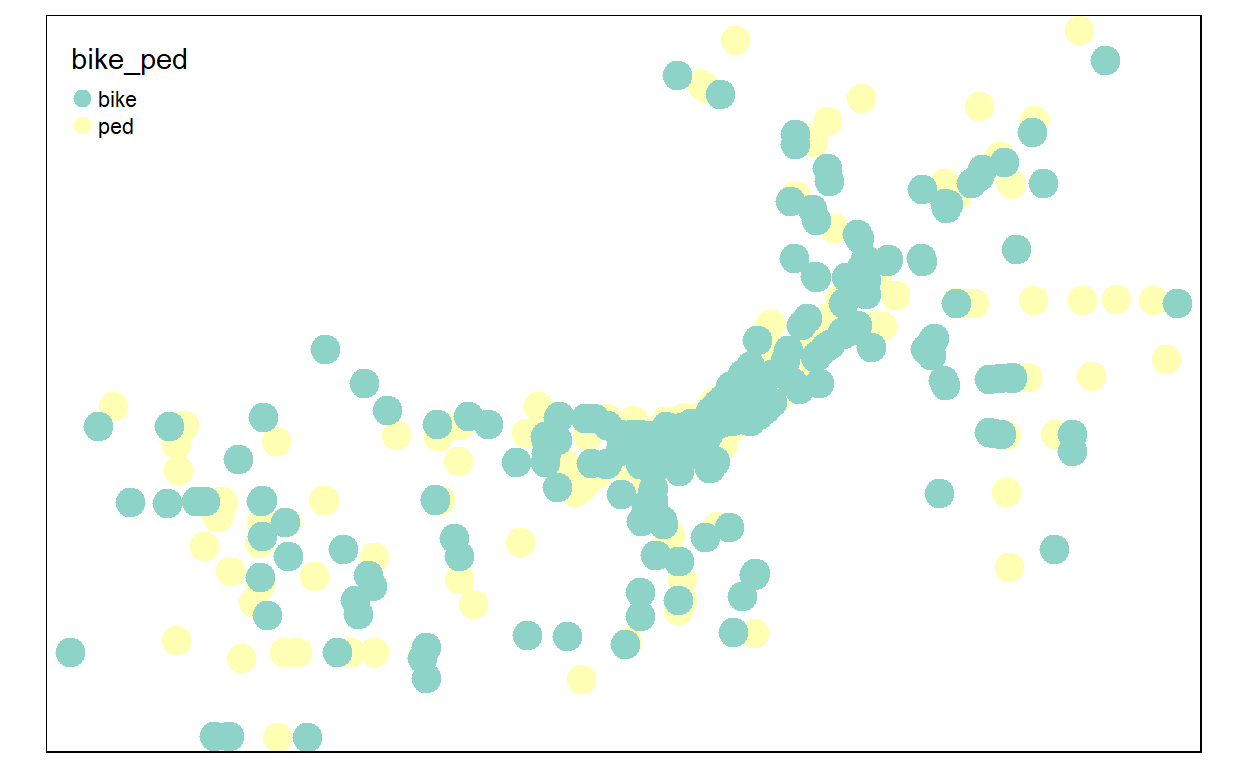
Comparing counts from Strava Metro and loop counters
Can Strava Metro data in Madison be a good indicator of overall bike traffic?
Population growth in Wisconsin
Mapping population growth since the 2020 census
Winners and losers in bike mode share
Where did bike commuting grow, where did it shrink.
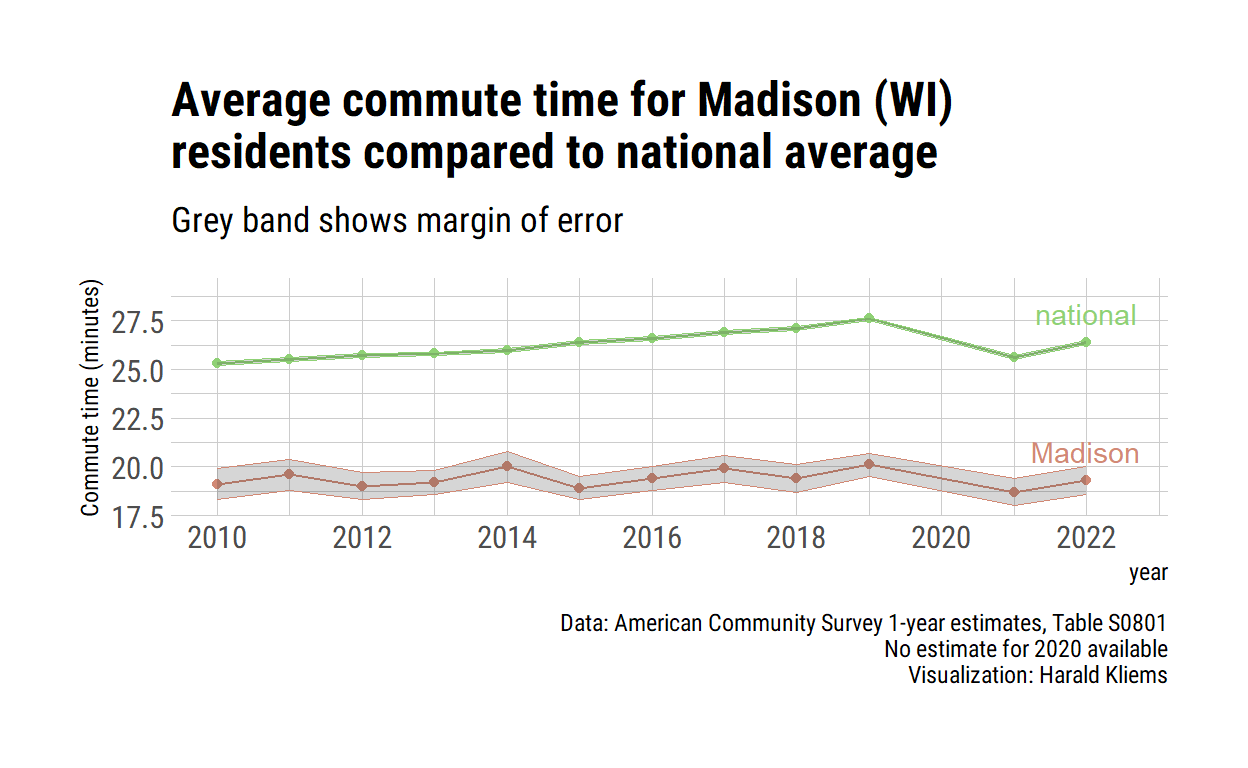
Quick post: Commute time in Madison
How long does it take Madisonians to get to work?
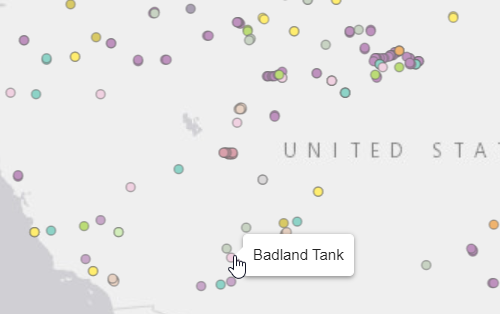
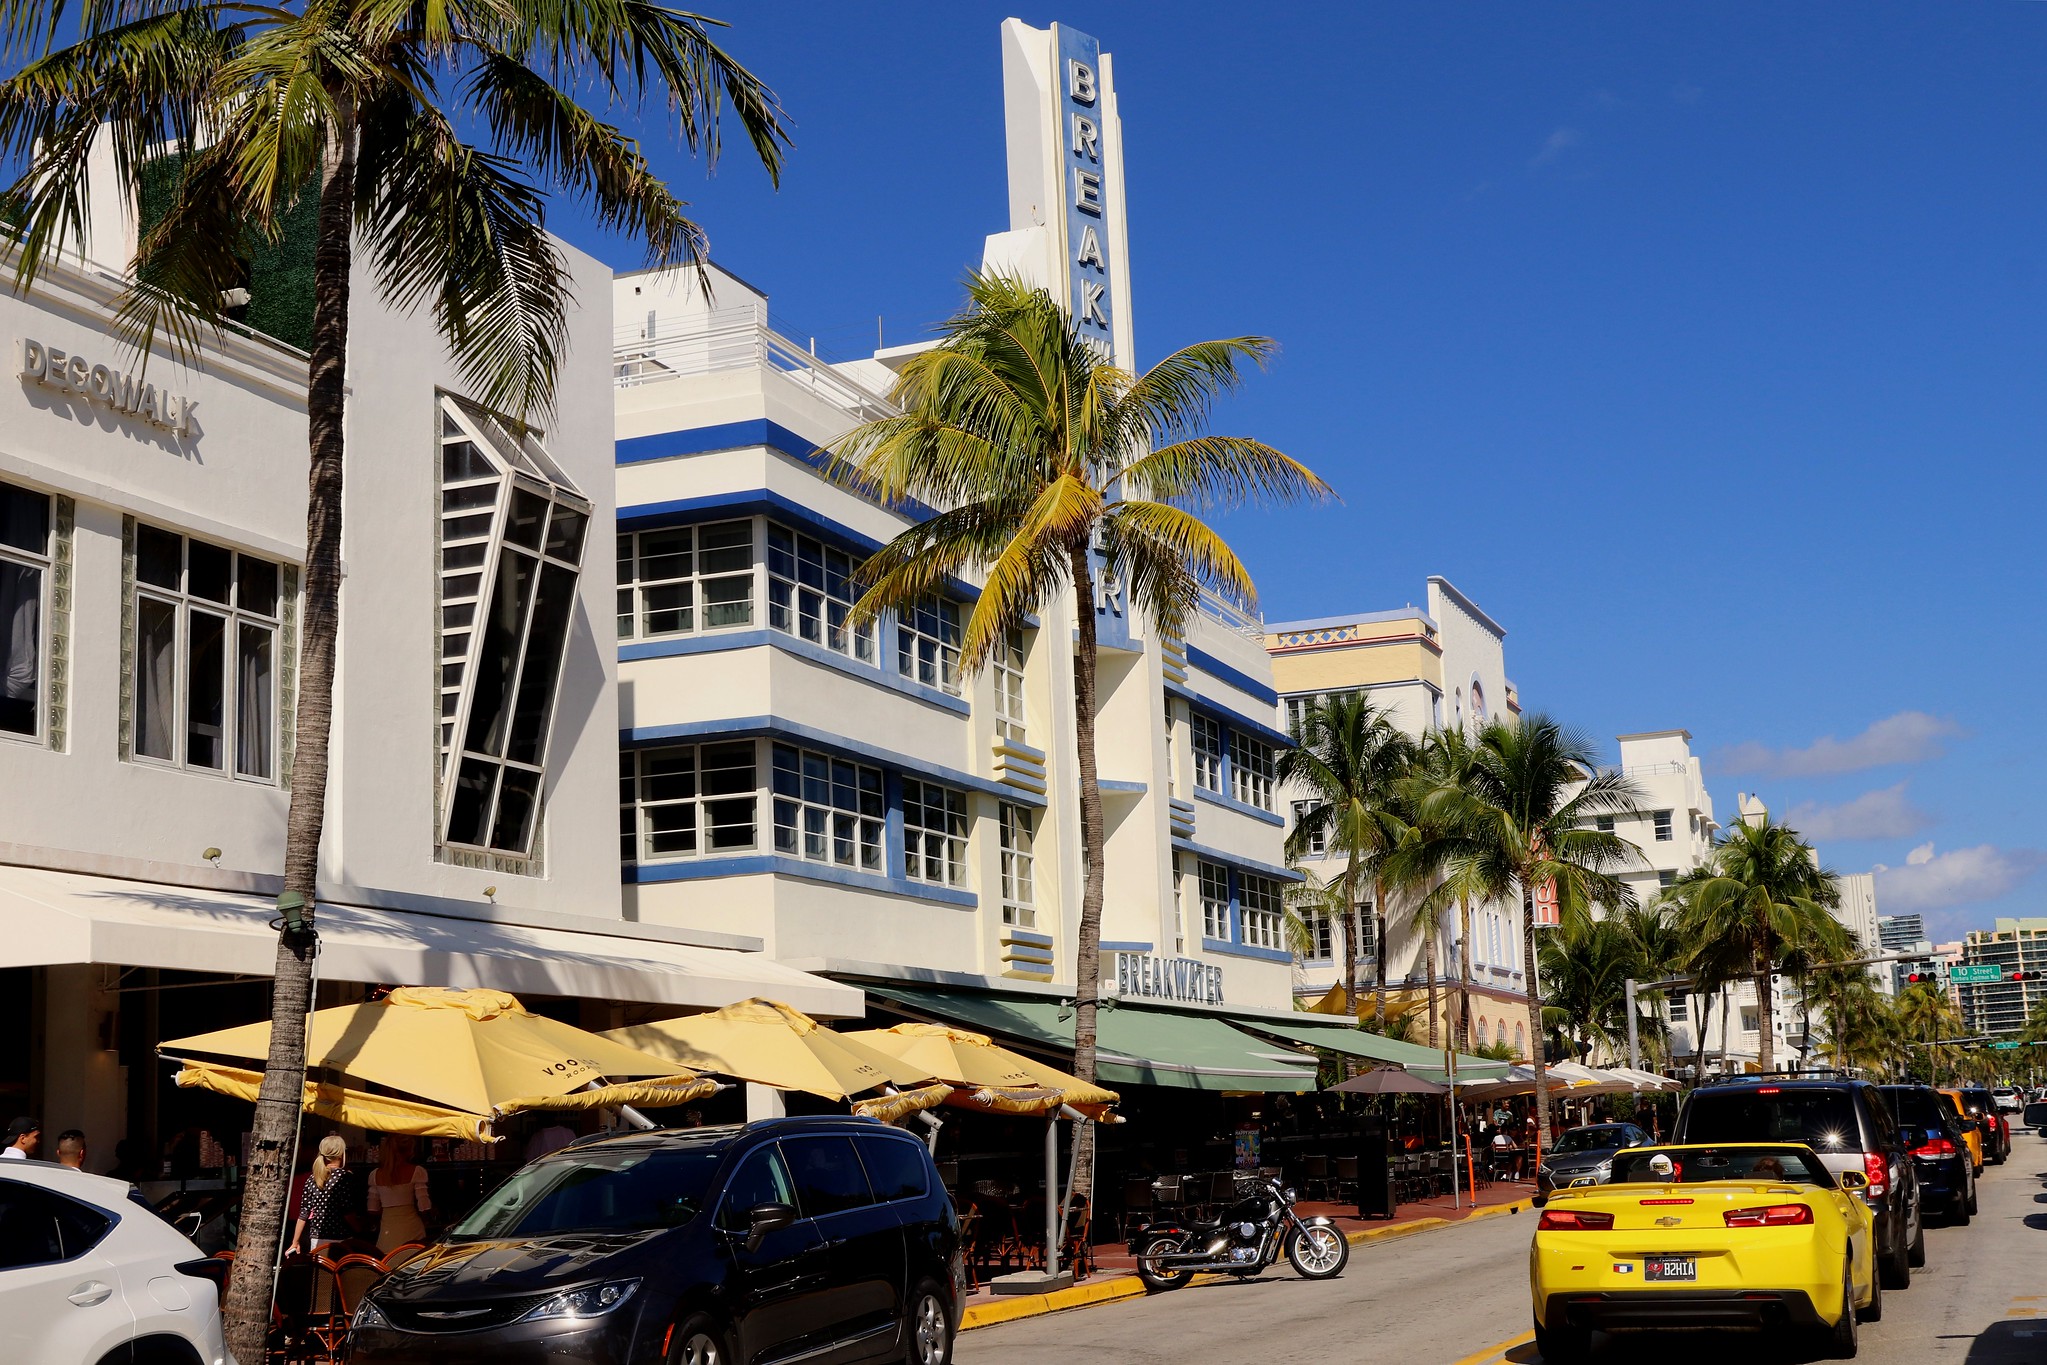
#30DayMapChallenge: A "bad" map of the US
Places that start with "bad" (but not "badger"!)
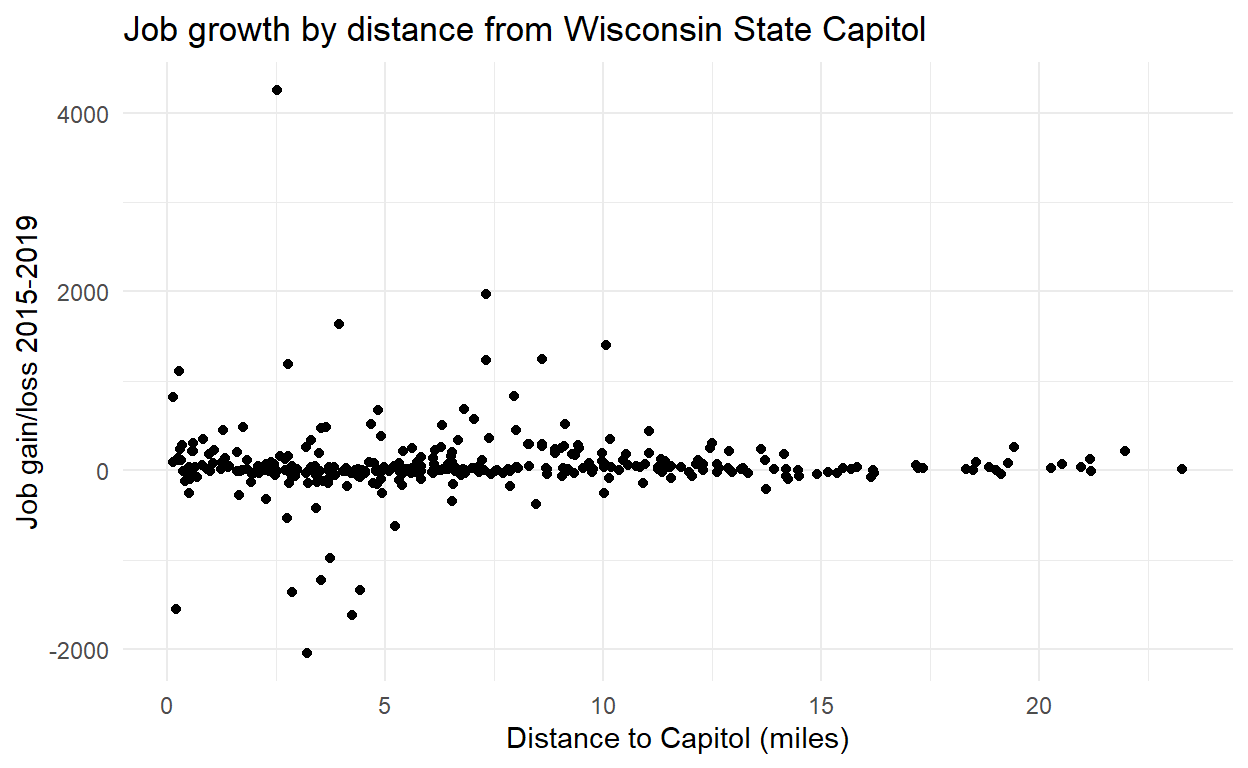
Quick post: Job growth in Dane County
Some maps and charts of 2015 and 2019 LEHD data
The State of Biking in Madison 2022
A look at several indicators of how many people biked (and took other means of transportation).
`ntdr 0.3.0`: Now available on CRAN
An R package for National Transit Database data

Rent and rent burden in Madison, Wisconsin
Some quick charts for Madison and how it compares to other US cities

Before and after the Metro Network Redesign
Comparing transit accessibility with the r5r package

Understanding Raw and Adjusted Data in the National Transit Database
A comparison of Madison Metro ridership data released in the National Transit Database at different points in time.

Map fun with City of Madison tax parcel data
Building age, property use, and architectural styles in Madison
Candidate questionnaires for local elections
Using `knitr` and `RMarkdown` for formatting form responses
Bicycle and pedestrian intersection crashes in Madison
A quick look at crash data to support efforts to no longer allow right turns on red.
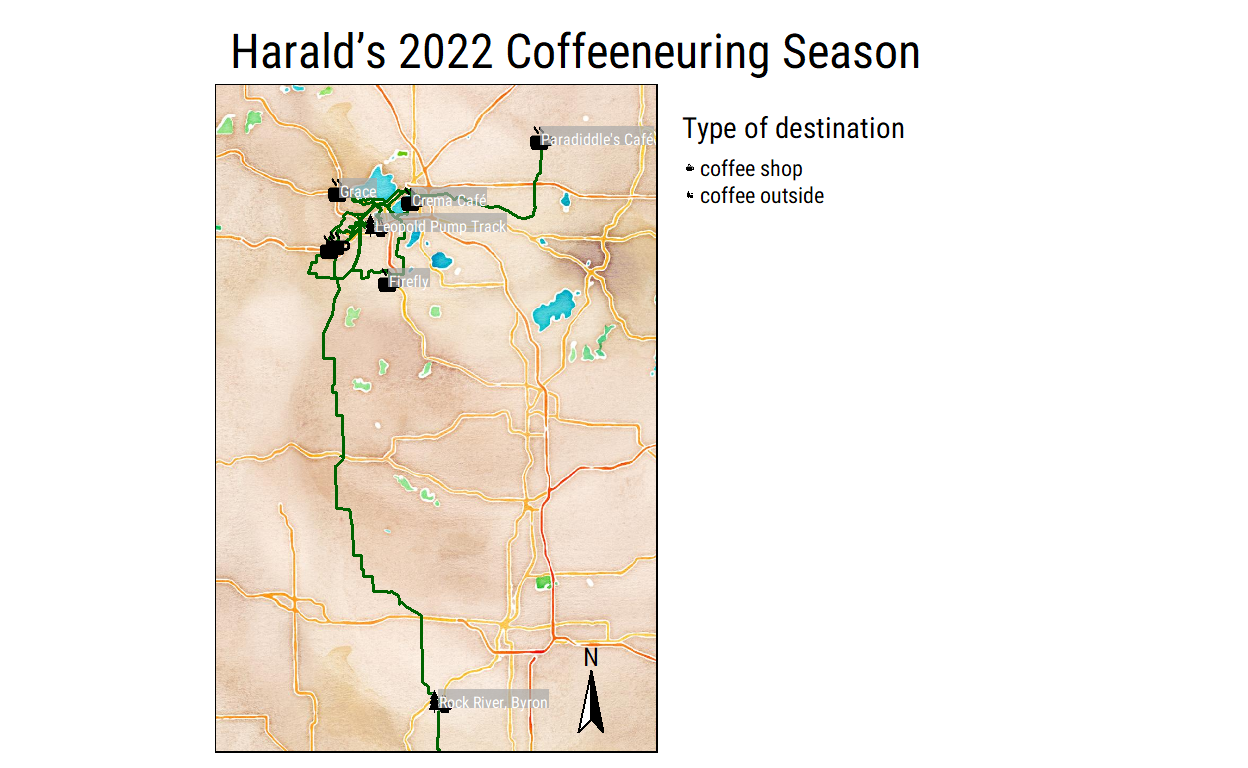
Coffeeneuring Challenge 2022
Making a map of this year's season
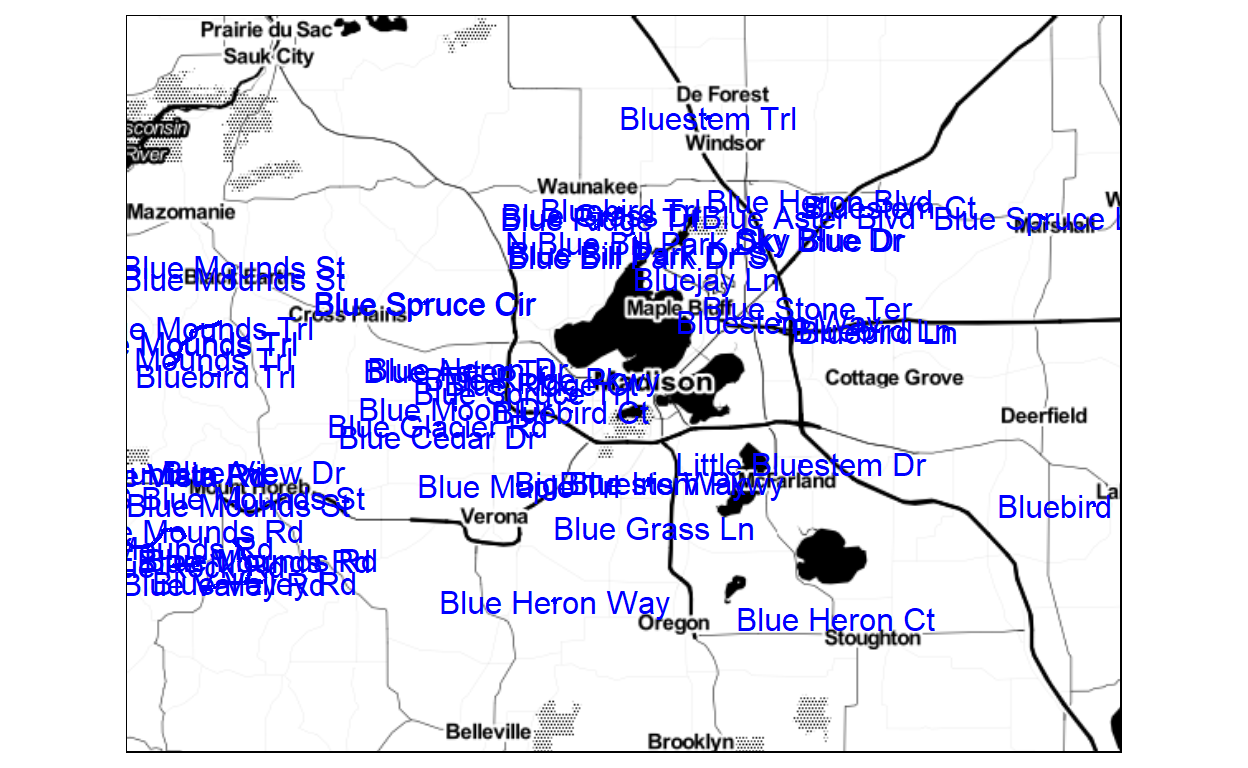
The color of roads
What colors are most represented in the road names of Dane County?
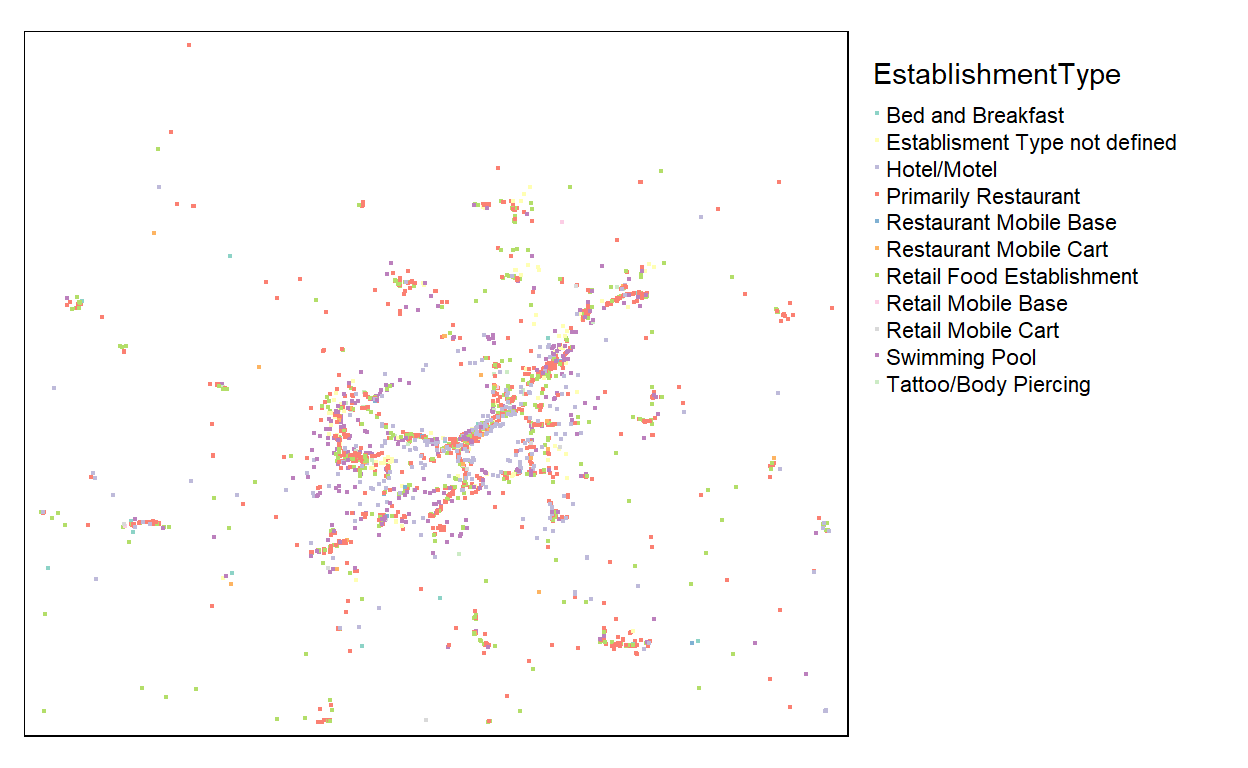
#30DayMapChallenge: Restaurant heat map of Madison
Challenge 15: Food/drink

#30DayMapChallenge: 5-minute map
5-minute isochrones around Metro Transit bus stops
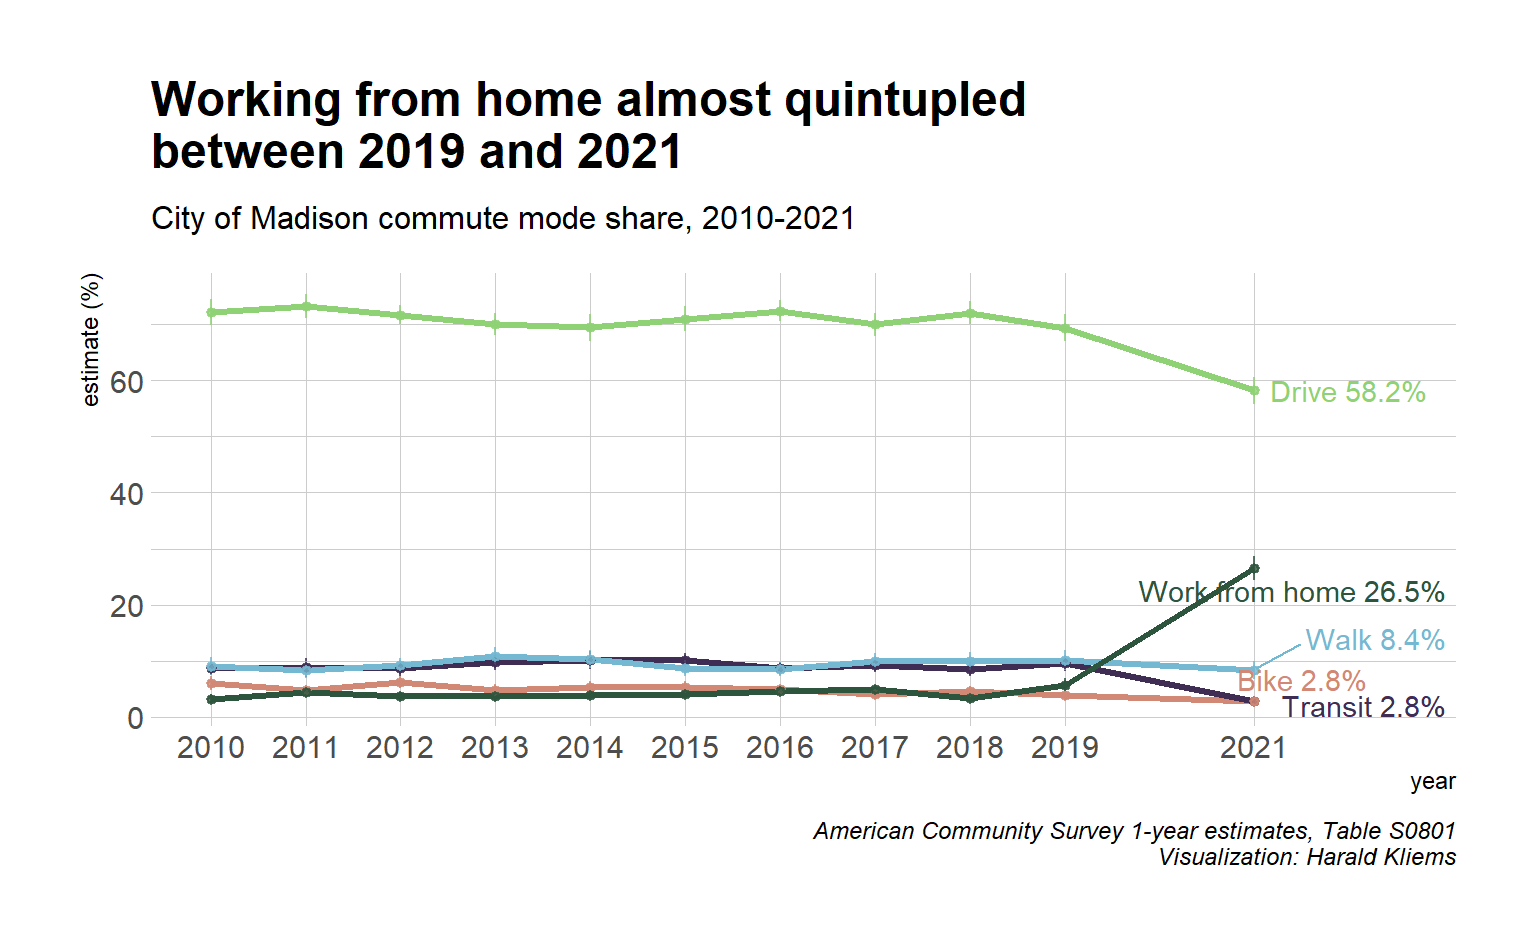
What's the latest on commute mode share in Madison?
Working from home has seen an unprecedented boom, while biking stagnates.
Wrangling unwieldy open records data
Using R, {msgxtractor}, and R Markdown to wrangle a set of msg files
How much housing is being built in Madison?
A look at housing permit data over time.
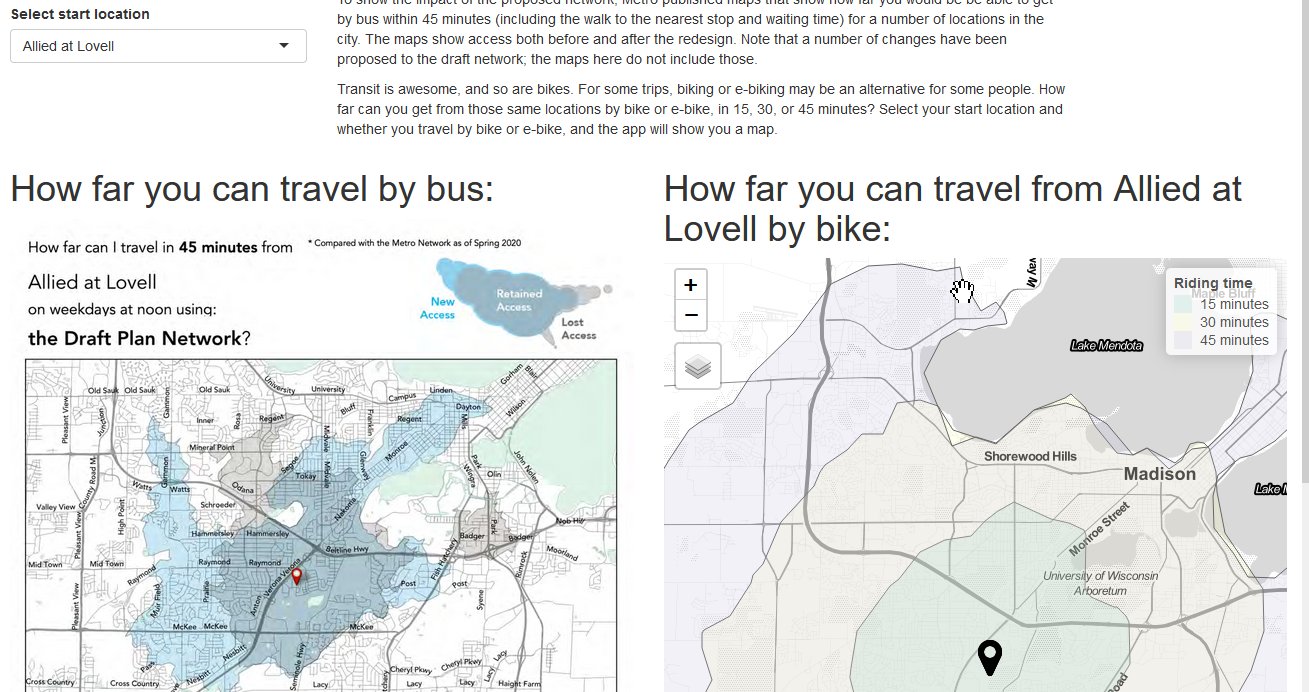
How far can you go?
Comparing how far you can travel by bus, bike, and e-bike in Madison, before and after the bus network redesign
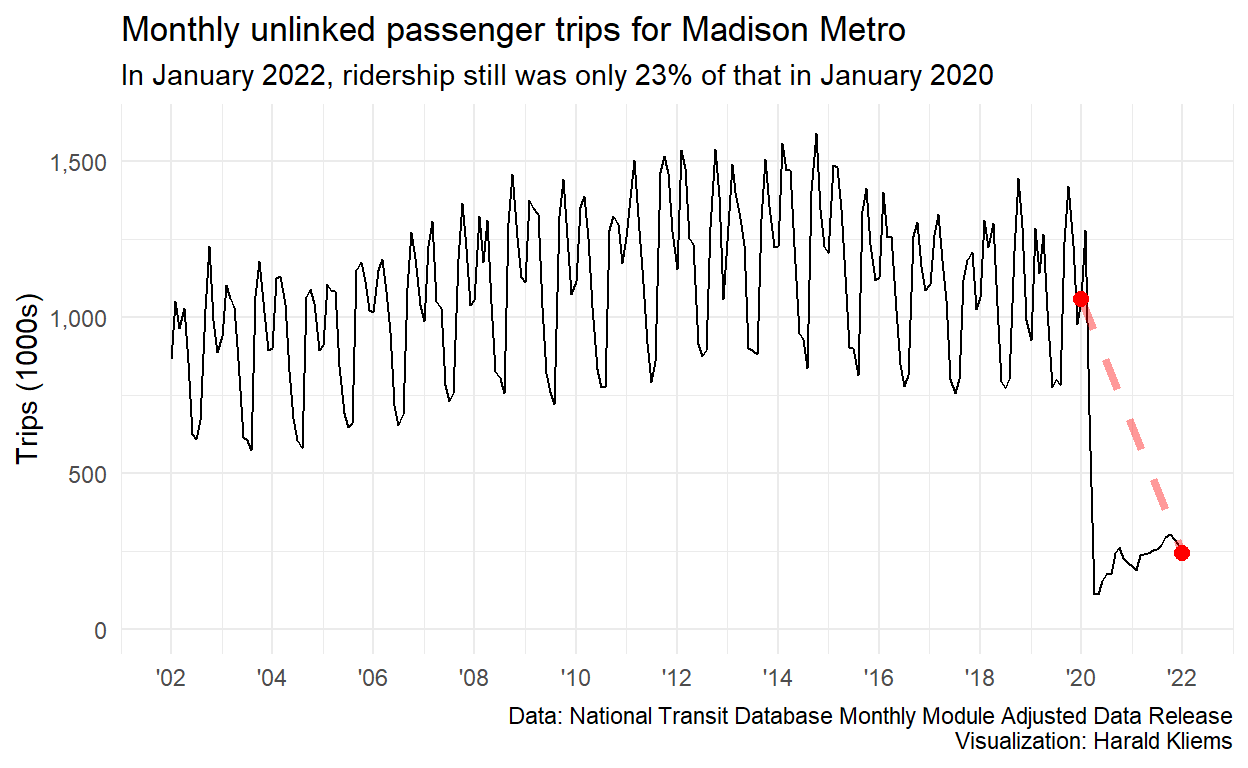
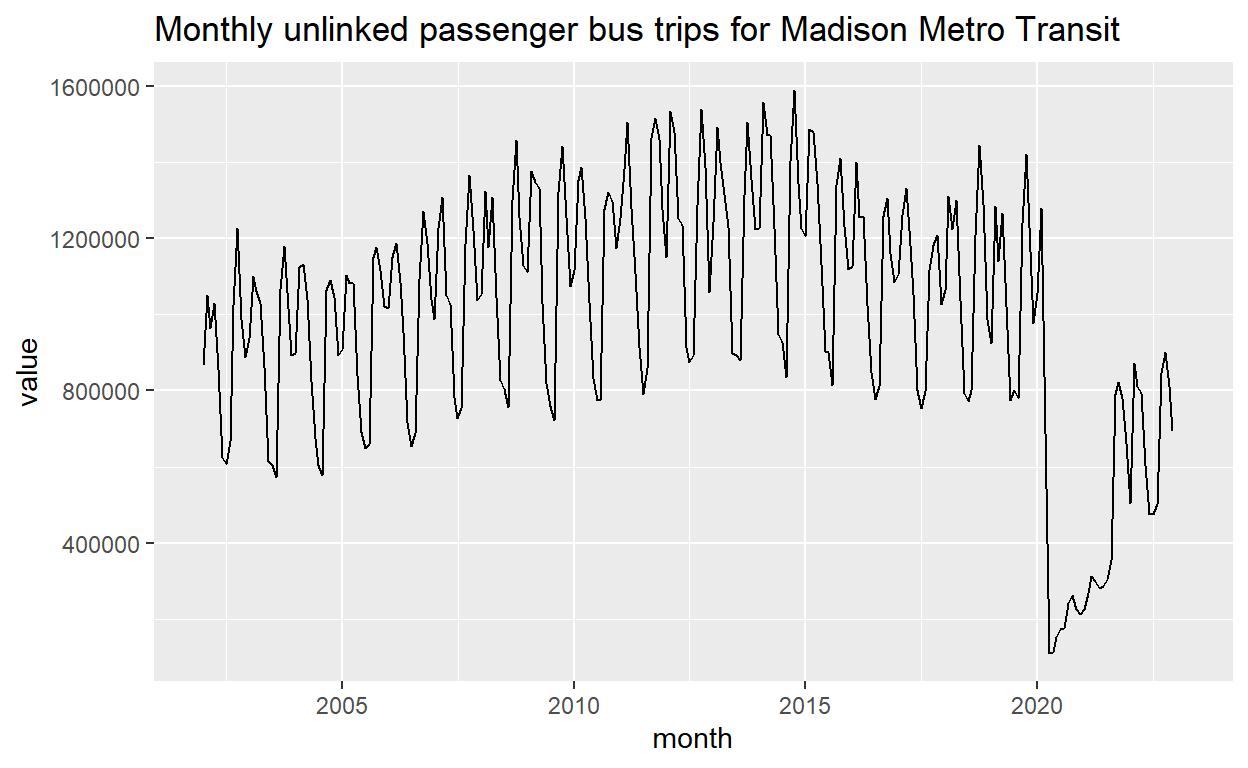
Metro Madison ridership has not recovered from COVID
A quick time series chart of Metro ridership going back to 2002
Boardings per bus per stop: A useful metric?
A follow-up on a post on Metro bus boardings per stop in Madison (WI)
A Vision Zero Twitter Bot for Madison
Using R, the rtweet package, and GitHub Actions to automate weekly tweets about traffic safety
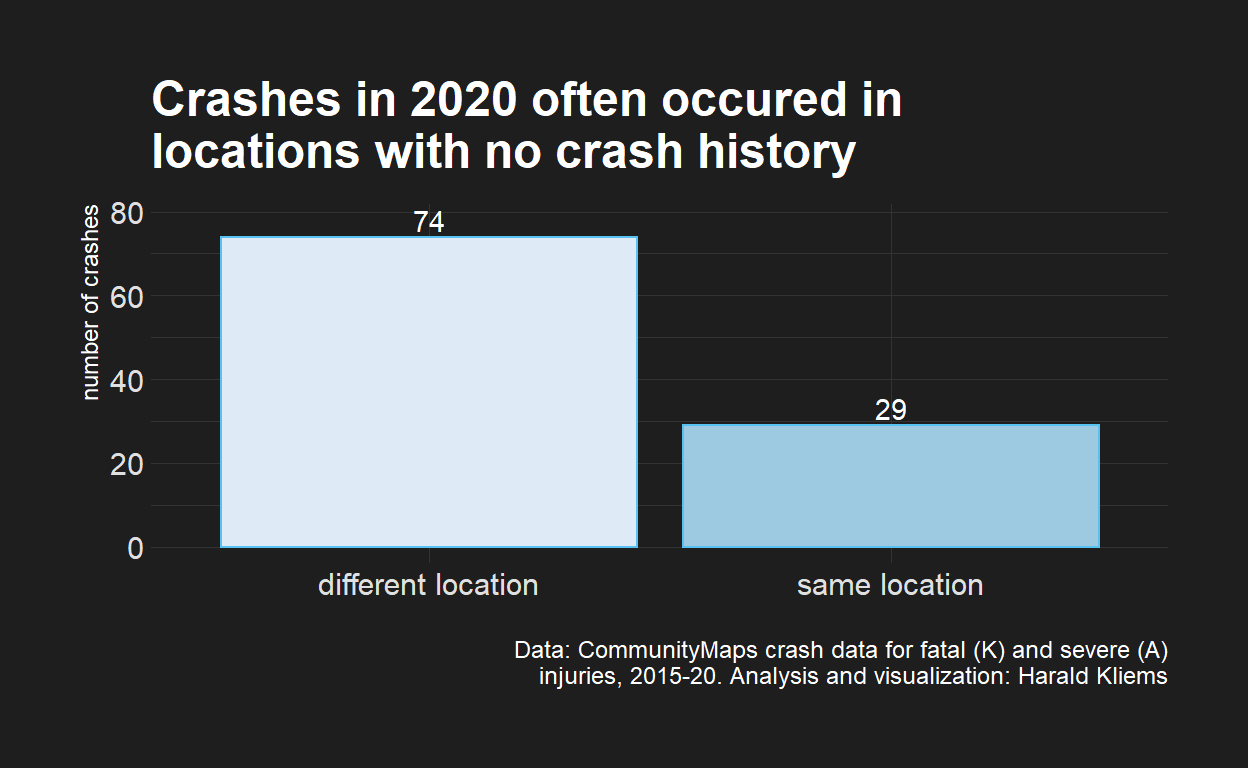
Do crashes have a history?
What the locations of past crashes can and cannot tell us about future crashes

Where the shelter can't go: Using data to dissect city policy-making
Policymakers proposed criteria for a where a shelter for homeless men in Madison (Wisconsin) could and couldn't go. This post uses public data to visualize these criteria, showing that in the end the resolution would have meant that the shelter can't go anywhere.

Scraping 4S
Web scraping and text analysis of the Society of Social Studies of Science's 2021 annual meeting panels.
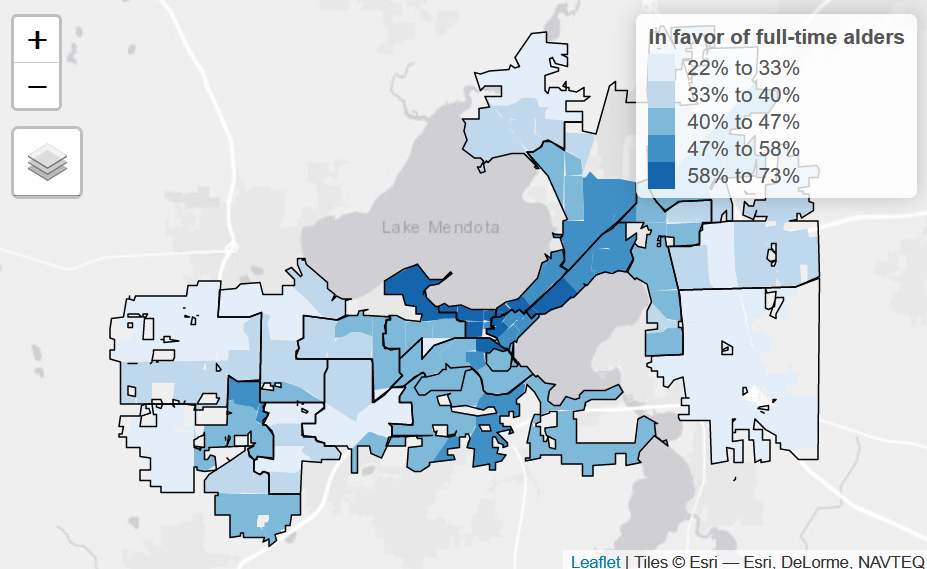
Madison Common Council Advisory Referendum 2021
How precincts voted about the questions whether Madison Alder should be a full-time job and how long terms should be
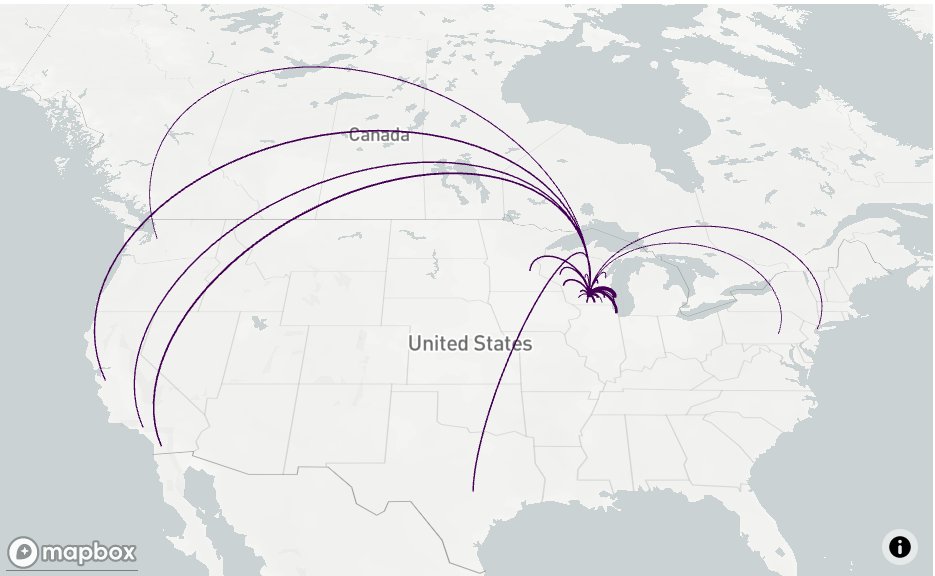
Dane County Migration Flows
The `tidycensus` package got an exciting new function
Race demographics by aldermanic district
What are the racial demographics of Madison's aldermanic districts
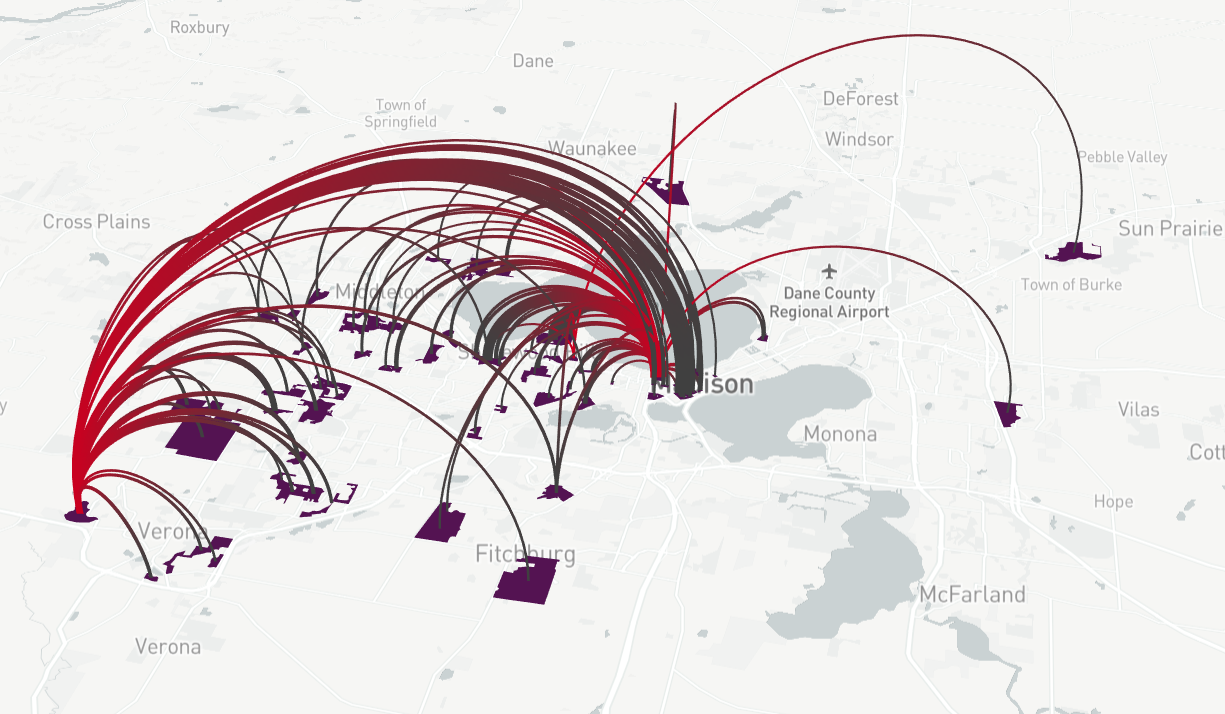
Visualizing commute flows in Wisconsin
LODES provides origin-destination data for connecting work and home. This article looks at patterns in those flows in Wisconsin, and especially in Madison
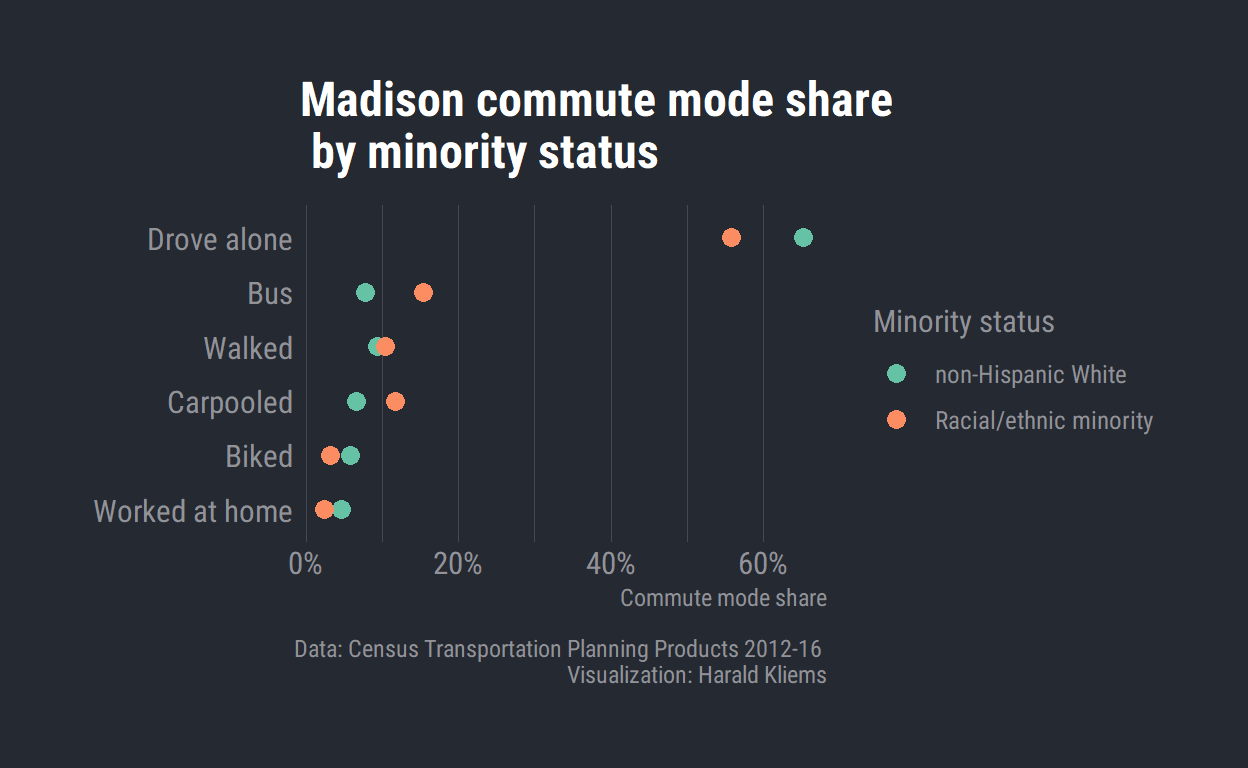
Getting to work in Madison
Commute mode share by minority status and income
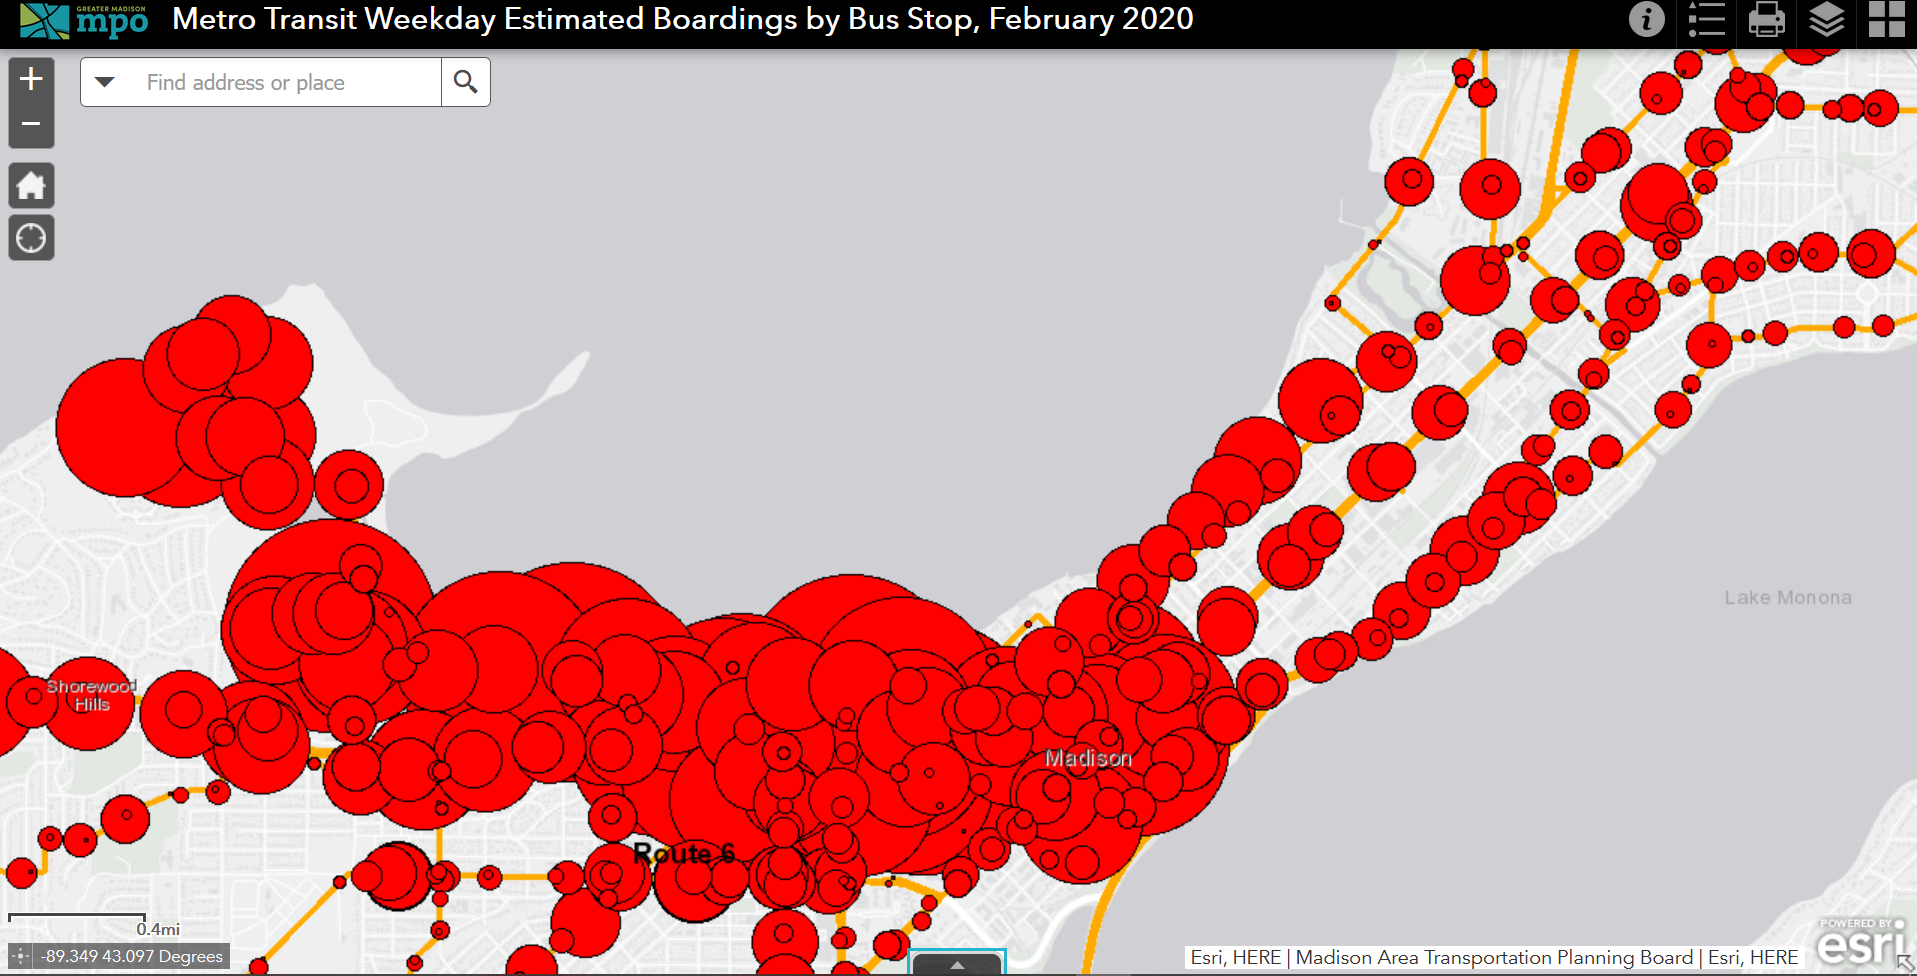
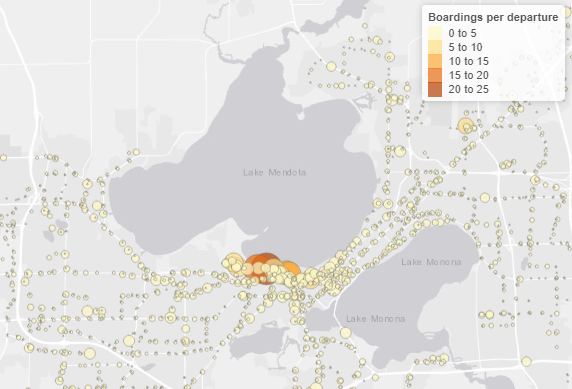
Bus boardings in Madison
Using the `mapdeck` package to visualize Metro Transit bus boardings in Madison (WI)
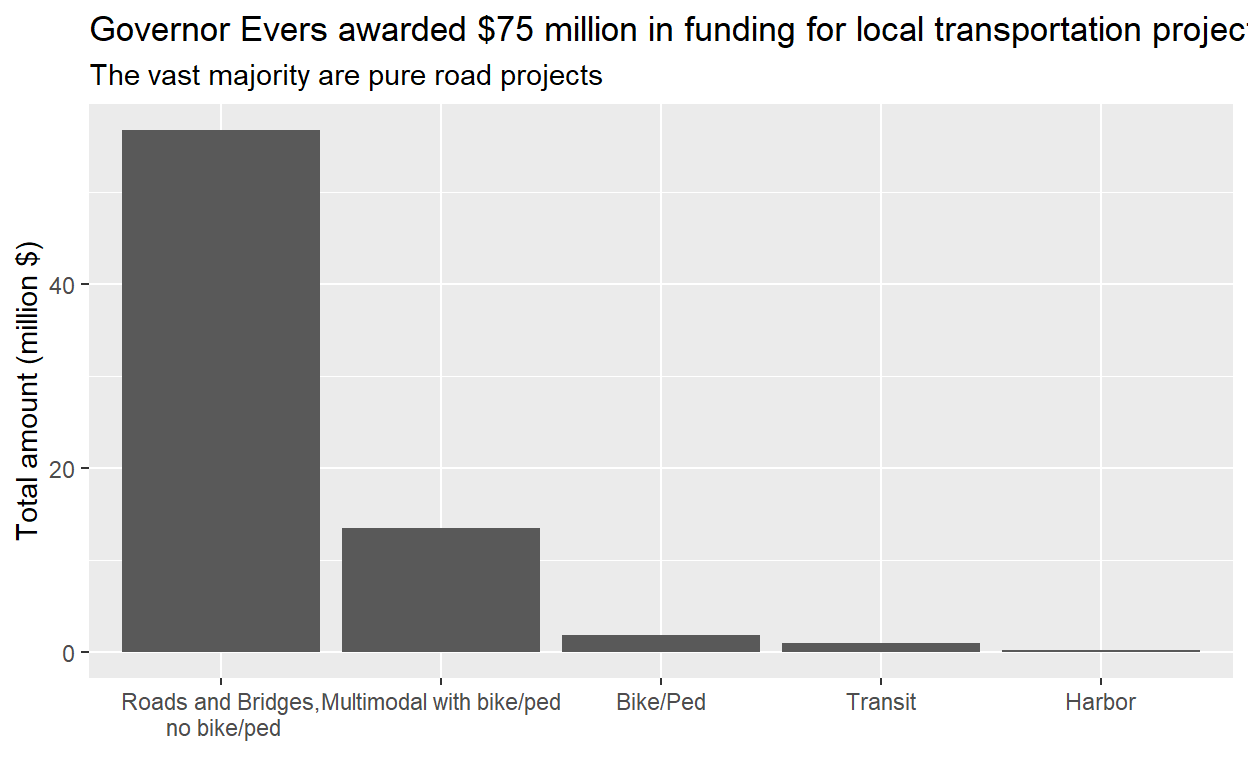
Transportation funding in Wisconsin remains car centric
A look at the 2020 Multimodal Local Supplement Awards in Wisconsin to assess how multimodal they really are

Some furter zoning analyses for Madison
A follow-up post on zoning and density in Madison and how it compares to other cities in the US.
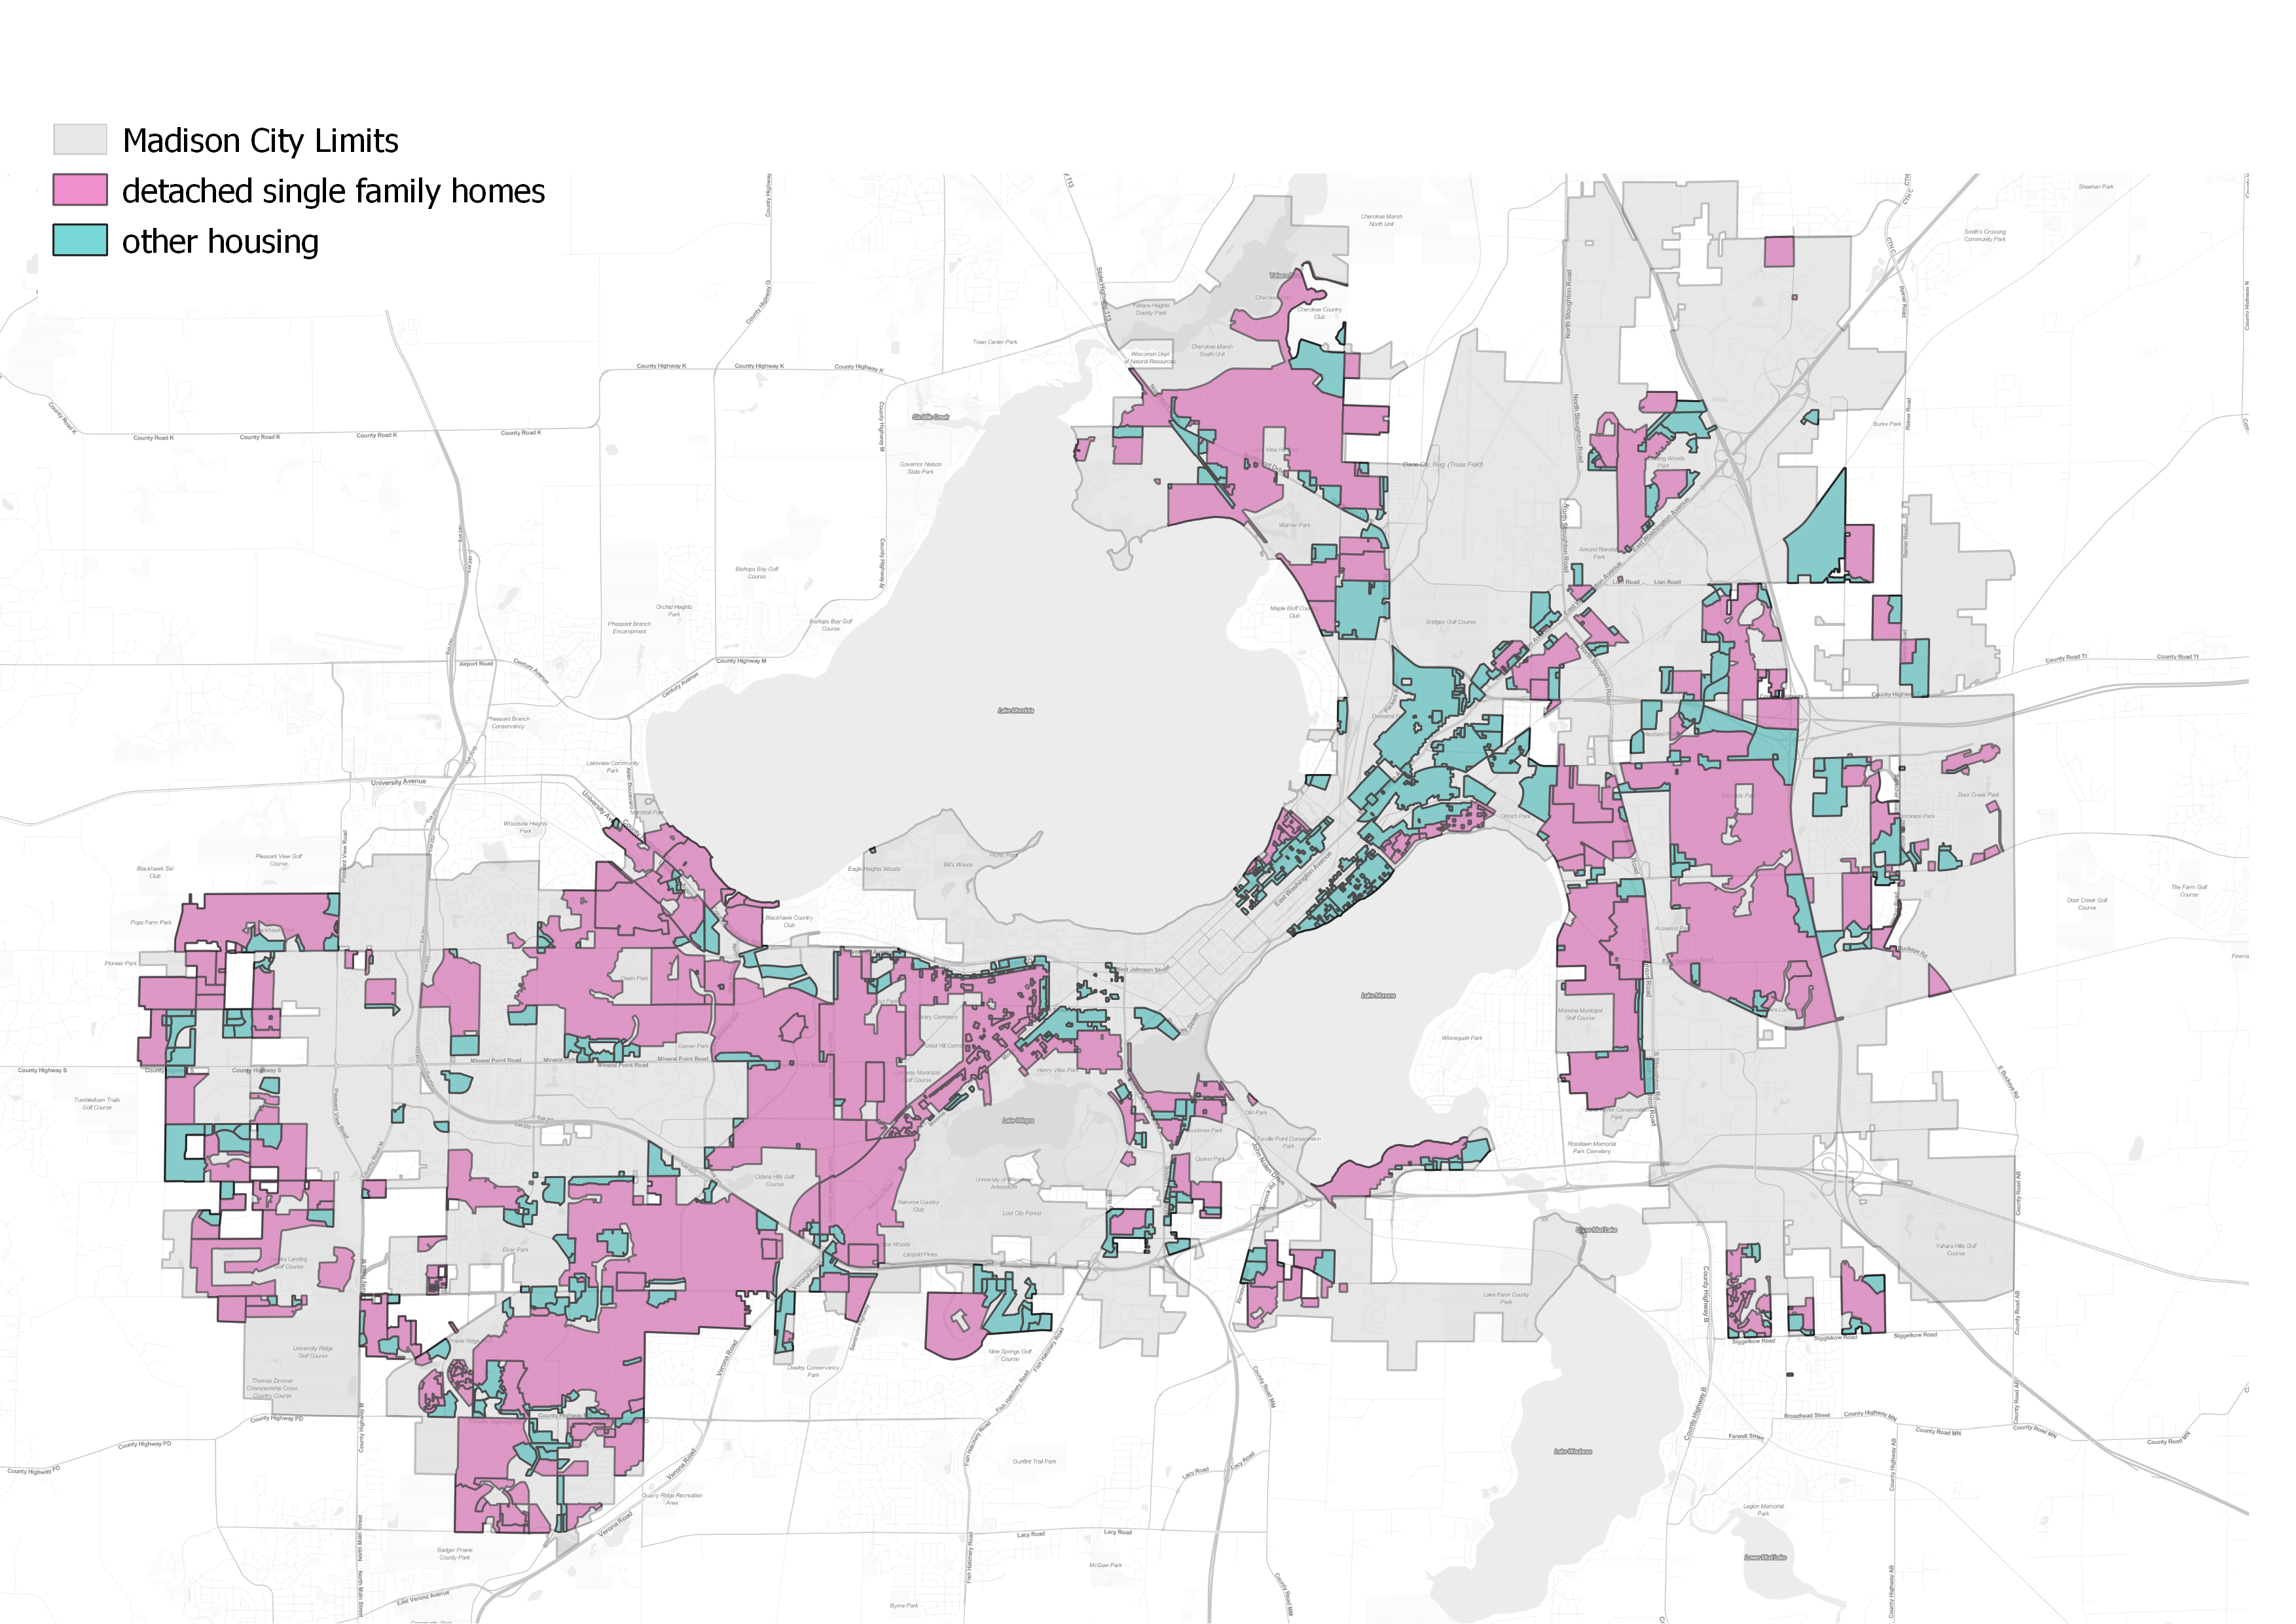
How much of Madison allows only detached single-family housing?
Recreating a _New York Times_ analysis of how much of Madison's residential areas only allowed single-family detached homes