The City of Madison is about to adopt their first Vision Zero action plan. The plan is central to guiding the city’s efforts to eliminate all fatal and serious traffic crashes by 2030. One main component of the plan is the high injury network. These are locations that in the past have seen a disproportionate number of crashes. As the draft action plan states: “50% of fatal and severe crashes occur on just 4% of city streets.” It intuitively makes sense: If we know that there are locations where a lot of crashes happen, let’s fix those locations and prevent crashes in the future.
However, a comment about data from Montreal’s recently released 2020 Vision Zero report (Ville de Montréal 2021) made me curious. The comment pointed out that when you look at the locations of fatal and serious crashes that happened in 2020 and compare them with crash locations between 2015 and 2019, 85% of those crashes occurred at a location with no recent crash history. This raises the question to what extent past crashes should steer our mitigation efforts (and what alternative approaches there may be.) But first we need to know if these numbers also hold true for Madison.
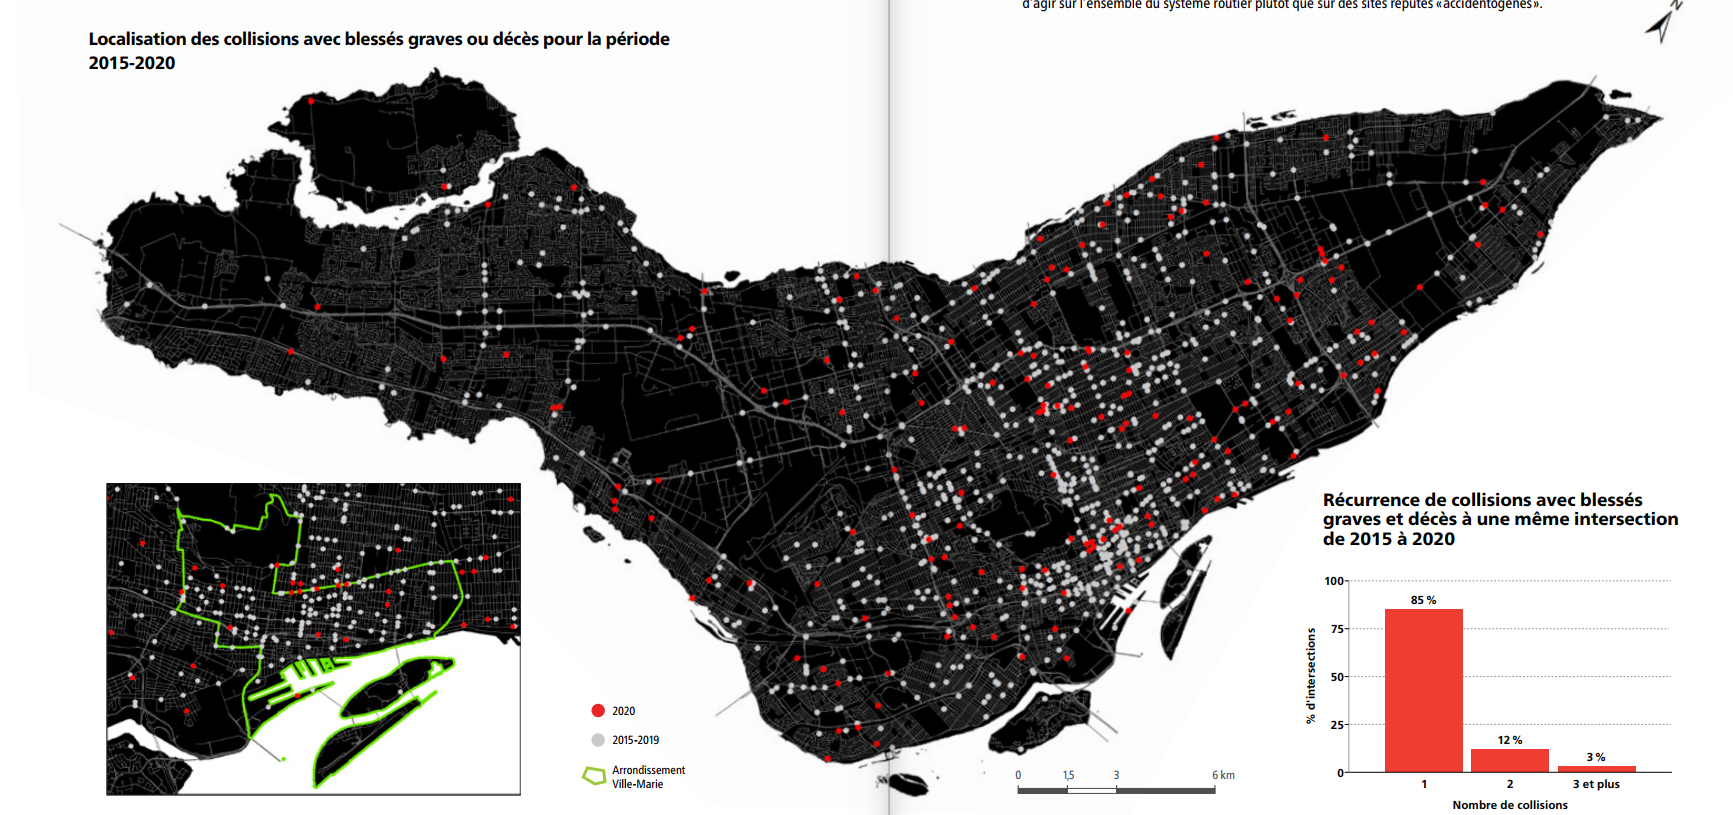
Crash data are available from Community Maps. As a first step we can look at the question visually. Here’s a map that compares 2020 and 2015-19 crashes:
Show code
download.file("https://CommunityMaps.wi.gov/crash/public/crashesKML.do?filetype=json&startyear=2015&en
dyear=2021&injsvr=K&injsvr=A&county=dane", "test.json")

df <- st_read("test.json")

madison_KA <- df %>%
  filter(muniname == "MADISON") %>%
  mutate(date = mdy(date),
         totfatl = as.numeric(totfatl))
Show code
tmap_mode("view")
madison_KA %>%
  mutate(yr = year(date),
         yr2020 = case_when(yr == "2020" ~ "2020",
                            yr %in% c("2015", "2016", "2017", "2018", "2019") ~ "2015-19")) %>%
  filter(!is.na(yr2020)) %>%
  tm_shape() +
  tm_dots(col = "yr2020", title = "", popup.vars = F, id = "yr") +
  tm_layout(title = "Fatal and serious crashes in Madison")
Clearly there were crashes in 2020 at new locations. Getting to a percentage requires additional steps. First, we create 125 ft buffers1 around all crash locations.
Now we check for overlap between the buffers. If a 2020 crash buffer intersects with any 2015-19 buffer, we would say it occurred “at the same location.” In other words, a 2020 crash can be at most 250 ft away from a 2015-19 crash to be considered to have happened at the same location.
Show code
poly_1519 <- madison_KA_buffered %>%
  filter(yr2020 == "2015-19") %>%
  st_combine() %>%
  st_make_valid()


madison_KA_buffered %>%
  filter(yr2020 == "2020") %>%
  mutate(new = case_when(lengths(st_intersects(.,poly_1519)) > 0 ~ "same location",
                         lengths(st_intersects(.,poly_1519)) == 0 ~ "different location")) %>%
  group_by(new) %>%
  st_drop_geometry() %>%
  summarize(n = n()) %>%
  ggplot(aes(new, n, fill = new)) +
  hrbrthemes::theme_modern_rc() +
  geom_col(show.legend = F) +
  geom_text(aes(label = n), nudge_y = 4, color = "white")+
  scale_fill_brewer() +
  xlab(element_blank())+
  ylab("number of crashes") +
  labs(title = str_wrap("Crashes in 2020 often occured in locations with no crash history", 40),
       caption = str_wrap("Data: CommunityMaps crash data for fatal (K) and severe (A) injuries, 2015-20. Analysis and visualization: Harald Kliems", 65))
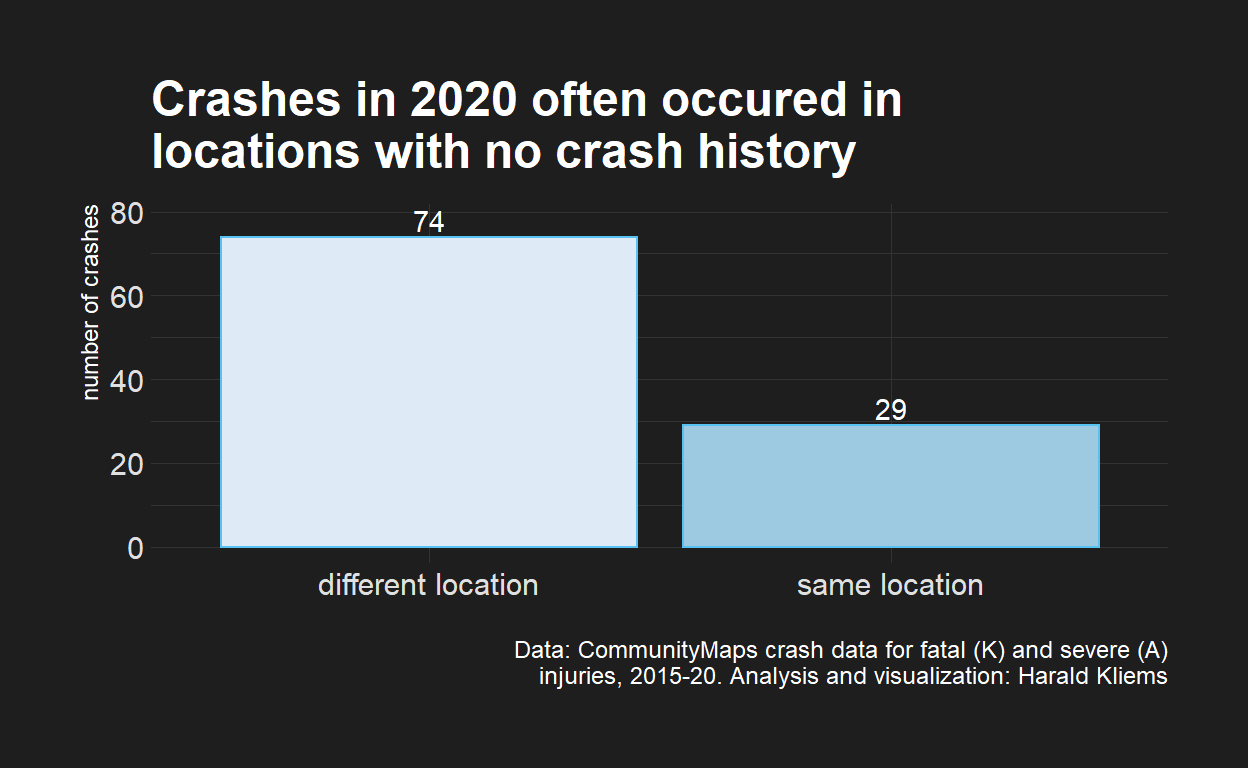
The result: Out of the 103 deadly and serious crashes that occurred in 2020, 29 (28%) were at a location where there had also been a crash between 2015 and 2019. The remaining 74 crashes (72%) happened at a location with no previous crash history. This is a lower proportion than what was found in Montreal, where 85% of crashes happened at locations without a crash history. It is possible that some or all of the difference between Madison and Montreal is an artifact of the analysis. For example, the Montreal figures mention “intersections” whereas this analysis does not match crashes to intersections. Changing the buffer around crash locations would also change the proportion (a larger buffer would lead to more matched crashes).
Methodological issues aside, what about the conclusion of the Montreal findings? “This observation reinforces the need to act on the entire road system rather than on sites considered ‘accident-prone.’” Pragmatically, few measures act on the entire road system (e.g. a city-wide speed limit reduction) and we need a process for prioritizing scarce resources. Maybe the takeaway should be that past crash history should be only one part of that prioritization process and that we need to be aware of its limitations.
The City uses 250 ft buffers around intersections to distinguish between intersection crashes and road segment crashes. Any crash within that buffer is counted as occurring at that intersection.↩︎