Where did bike commuting grow, where did it shrink.

Bike commuting in Madison isn’t doing so well. In my previous post, using American Community Survey (ACS) one-year estimates, we saw that commuting by bike and other cycling metrics have declined in Madison over the last 10 or so years. The post also presented some comparisons with national trends and a few other US cities. I picked those particular cities based on my personal curiosity rather than on a particular metric.
Lately I was wondering, though: Are there places where bike commuting actually has grown, and is there something we can learn from those places? So this post is a first step in this work.
Rather than using one-year estimates, we’ll use five-year estimates because they have smaller margins of errors. These estimates aren’t available yet for the 2022 ACS data (they’ll be released in December), and so we’ll compare the 2017-2021 period with 2012-2016. The geographic level of analysis will be at the city (or in ACS terminology: place) level.
Places can be small, and so there are a lot of them and downloading the data takes a bit of time.
We’ll exclude small cities and towns, defined by having fewer than 30,000 workers, from the analysis.
Next we focus only on the bike commuting variable and do some data manipulations. Importantly, we make sure to only include cities where the change in bike commuting is statistically significant at the 90% level.
Now we pick the top and bottom 15 from the remaining list:
Well, actually it turns out that there aren’t 15 cities where the bike mode share has grown over this time period, and so we’ll include the bottom 15 and the cities where there has been growth.
Let’s map the winners and losers:
The size of the dots represents the bike mode share in the 2012-2016 period; the color represents the change in mode share.tmap can’t display two legends in interactive maps.
Here’s a table of the data:
| Bike commute mode share | Change (absolute) | |||
|---|---|---|---|---|
| 2012-2016 | 2017-2021 | Change (%pt.) | ||
| Miami Beach, Florida | 4.1% | 6.2% | +2.1% | +51% |
| Jersey City, New Jersey | 0.4% | 0.8% | +0.4% | +100% |
| Gaithersburg, Maryland | 0.1% | 0.4% | +0.3% | +300% |
| Plantation, Florida | 0.1% | 0.4% | +0.3% | +300% |
| West Covina, California | 0.0% | 0.3% | +0.3% | +Inf% |
| Longview, Texas | 0.0% | 0.3% | +0.3% | +Inf% |
| New York, New York | 1.1% | 1.4% | +0.3% | +27% |
| Toledo, Ohio | 0.2% | 0.4% | +0.2% | +100% |
| Boulder, Colorado | 10.3% | 8.8% | −1.5% | −15% |
| Bloomington, Indiana | 3.9% | 2.4% | −1.5% | −38% |
| Bozeman, Montana | 5.6% | 4.0% | −1.6% | −29% |
| Medford, Oregon | 2.2% | 0.6% | −1.6% | −73% |
| Madison, Wisconsin | 5.2% | 3.6% | −1.6% | −31% |
| Portland, Oregon | 6.5% | 4.7% | −1.8% | −28% |
| Santa Barbara, California | 4.8% | 2.9% | −1.9% | −40% |
| Flagstaff, Arizona | 4.4% | 2.4% | −2.0% | −45% |
| Chico, California | 5.2% | 3.1% | −2.1% | −40% |
| Fort Collins, Colorado | 6.6% | 4.4% | −2.2% | −33% |
| Berkeley, California | 8.2% | 5.9% | −2.3% | −28% |
| Eugene, Oregon | 7.4% | 4.8% | −2.6% | −35% |
| Missoula, Montana | 7.2% | 4.4% | −2.8% | −39% |
| Santa Cruz, California | 9.5% | 6.2% | −3.3% | −35% |
| Davis, California | 21.1% | 13.8% | −7.3% | −35% |
| Data: American Community Survey 5-year estimates, Table S0801 | ||||
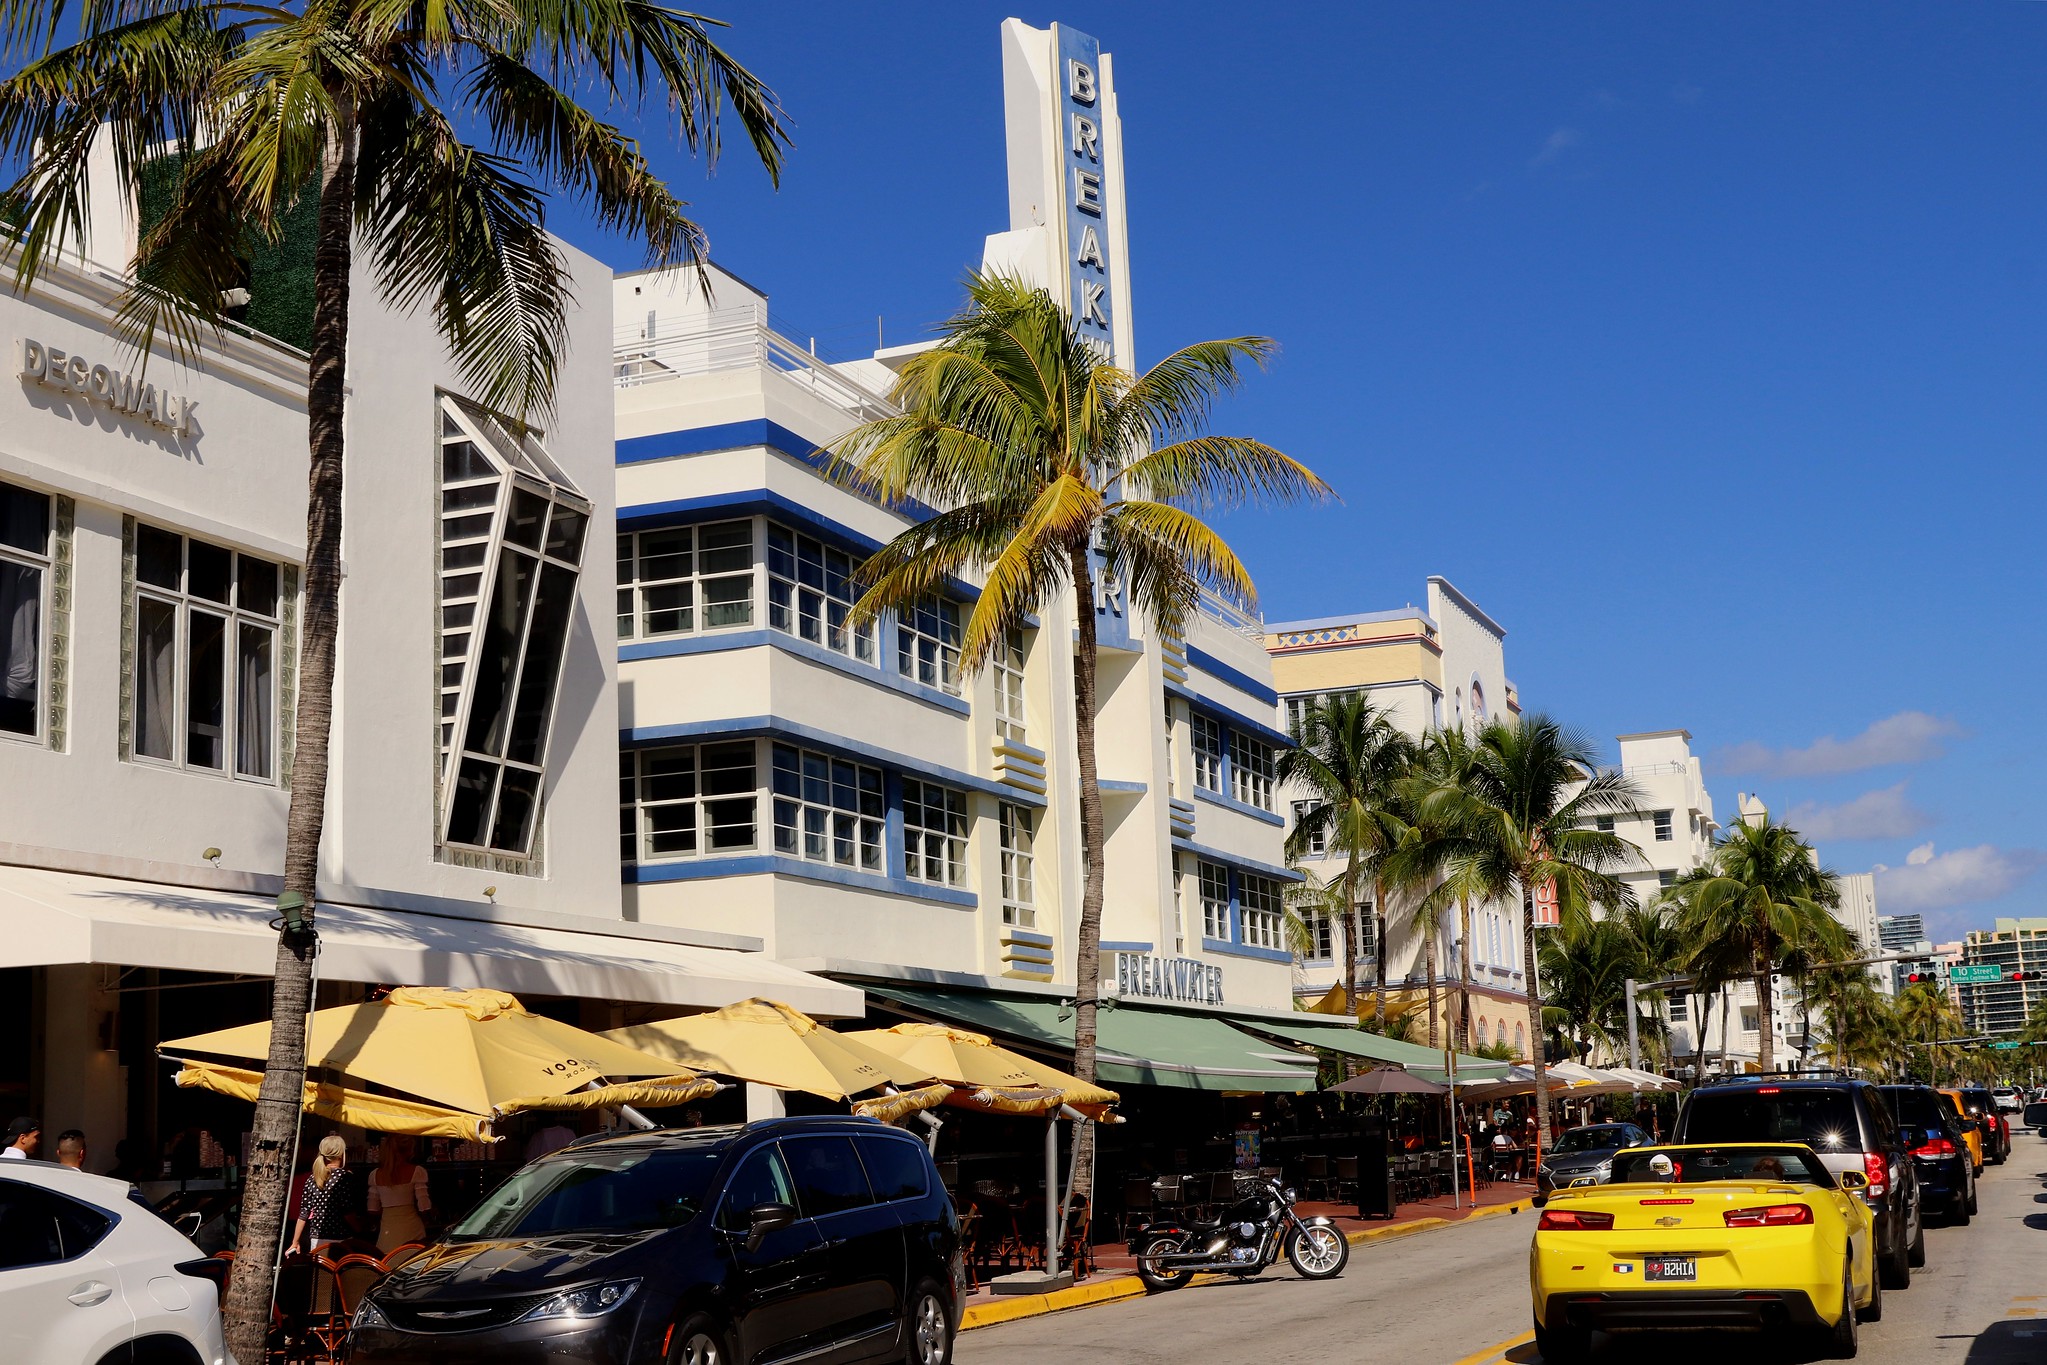
To come back to my initial question: Is there something to be learned from the communities that managed to grow their bike mode share? Based on what we’re seeing here, I think the only city worth taking a closer look at is Miami Beach. The city’s bike commute mode share grew from in 2012-2016 to % in the 2017-2021 period. All other cities that saw growth in bike commute share had an increase below 1 percentage point, and the 2021 mode share is below 1.5% for all of them.
A quick web search about Miami Beach shows that they adopted a Bicycle Pedestrian Master Plan and Street Design Guide and, at least according to the city website, “the city has been aggressively implementing lanes ever since. In 2017 Street Plans started working closely with the City of Miami Beach to further design and implement priority ‘quick build’ projects.” The Places for Bikes rating has Miami Beach at 46 points, which is a decent but not outstanding score. Madison, for example, scores a 58. Other factors may include Miami Beach’s unique geography on a narrow strip of land, and its character as a resort town dominated by the tourism sector.
We will see what the most current estimates will bring—based on what I’ve seen with the 2022 one-year estimates, I wouldn’t be surprised if the five-year estimates including 2022 will further reduce the number of cities that have seen growth. Stay tuned: the data will be out soon.
tmap can’t display two legends in interactive maps.[↩]For attribution, please cite this work as
Kliems (2023, Nov. 9). Harald Kliems: Winners and losers in bike mode share. Retrieved from https://haraldkliems.netlify.app/posts/2023-11-09-winners-and-loser-in-bike-mode-share/
BibTeX citation
@misc{kliems2023winners,
  author = {Kliems, Harald},
  title = {Harald Kliems: Winners and losers in bike mode share},
  url = {https://haraldkliems.netlify.app/posts/2023-11-09-winners-and-loser-in-bike-mode-share/},
  year = {2023}
}