A very quick chart: There are large differences between how transit agencies (in the US and in Europe) have managed to recover their pre-COVID ridership. Madison Metro’s general manager has always been very open about the fact that recovery would take several years: Metro is facing staffing shortages, which prevents them from expanding service. Funding right now is not a problem, but once pandemic recovery funds run out it will be. Finally, UW-Madison as well local and state government agency have been large drivers of ridership – it remains to be seen if a loss of peak commutes can be substituted with other transit trips.
But first we have to ask: What do the ridership numbers look like? The National Transit Database provides monthly ridership time series data all the way back to 2002. Here is a time series plot of that data:
Show code
library(readxl)
bus <- read_excel("data/January 2022 Ajusted Database.xlsx", sheet = 3)
library(tidyverse)
library(lubridate)
bus_long <- bus %>%
  pivot_longer(cols = 10:250, names_to = "month", values_to = "value") %>%
  mutate(date = my(month)) %>%
  filter(Agency == "City of Madison" & Modes == "MB")

bus_long %>%
  ggplot(aes(date, value/1000)) +
  geom_line() +
  labs(title = "Monthly unlinked passenger trips for Madison Metro",
       subtitle = "In January 2022, ridership still was only 23% of that in January 2020",
       caption = "Data: National Transit Database Monthly Module Adjusted Data Release\nVisualization: Harald Kliems") +
  ylab("Trips (1000s)") +
   scale_x_date(
    NULL,
    breaks = scales::breaks_width("2 years"),
    labels = scales::label_date("'%y")
  ) +
  scale_y_continuous(
     labels = scales::label_comma(),
     limits = c(0, 1600)) +
  geom_line(data = bus_long %>% filter(date == "2020-01-01" | date == "2022-01-01"), color = "red", size = 1.5, linetype = 2,
            alpha = 0.4) +
  geom_point(data = bus_long %>% filter(date == "2020-01-01" | date == "2022-01-01"), color = "red", size = 2.5) +
  theme_minimal()
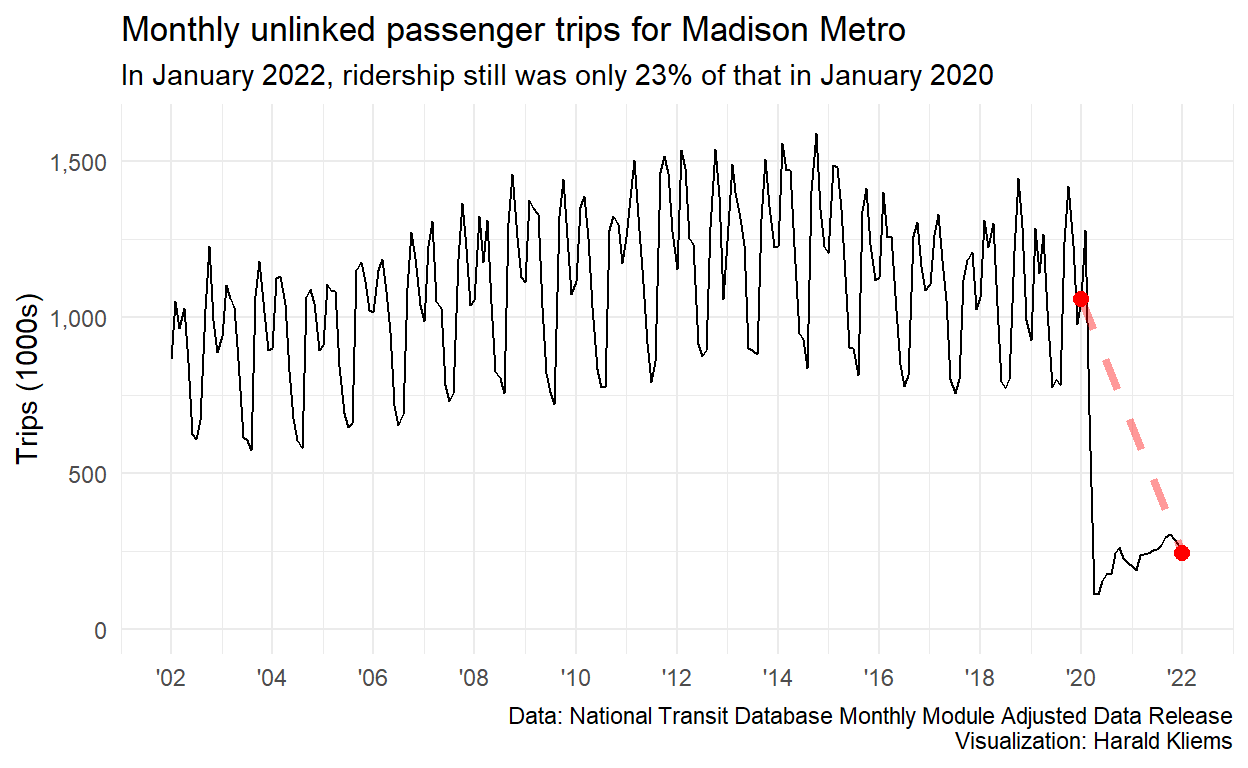
We can see: While ridership is well above its worst pandemic lows, there still is a long way to go until we get back to pre-pandemic numbers. In January 2022, the latest month available, ridership was less than a quarter than what it was in January 2020.