In previous posts I have worked with data from the US Census Bureau’s American Community Survey (ACS). ACS is great for data on people and households. For employment data, however, there is a better (or maybe complementary) source: The LEHD Origin-Destination Employment Statistics (LODES). The data can be accessed via a somewhat clunky web interface, On the Map or downloaded and then analyzed in your software of choice. One unique feature of LODES is the “OD” part in its name: It provides the number of people who commute from one census block to another. This can be helpful in transportation or general urban planning. For example, are there major employment centers that have a large share of its workers living in the same part of town, and could they therefore easily be served by transit?
In this post I will look at LODES data for Madison and the state of Wisconsin as a whole. The latest LODES data available is from 2018.
Data preparation
The file structure is explained here, page 6. There are two geography identifier variables, w_geocode and h_geocode, and a number of variables for the number of jobs for that geography pair. S000 is the one for total jobs.
The mapdeck arc visualization requires either two pairs of coordinates or sfc columns.
I will get TIGER geographies with the tigris package, calculate centroids with sf, and then merge with the LODES data. Note that LODES uses the 2010 vintage for its geographies, whereas tigris defaults to the most recent vintage.
Let’s look at the distribution of the number of jobs per origin-destination pair:

This does not look terribly promising–maybe block pairs are the wrong unit of analysis, with a huge number of them only having a single job-home pair. Aggregation to block groups or tracts may make more sense, but for now I’ll proceed with the blocks.
Commute flows in Wisconsin
The number of block pairs is large, and so I’ll sample the 100 blocks with the largest number of commutes.
Now we can do a double join with the block centroids: First, join on the work geocode, then do another join on the home geocode. This will create a new dataframe with two geometry columns. In order to work with the mapdeck package, the dataframe needs to be turned into an sf object. Finally, we add a thickness helper variable based on the number of jobs in the OD pair. This variable will specify the width of the arcs in the visualization.
Census blocks can be oddly shaped, and so it’s a good idea to plot the actual blocks and not just their centroids.
Visualizing the flows
Now we can visualize the top-100 commute flows in the state:
Wow, it is immediately obvious how dominant commute flows in the Madison area are! And by zooming in you can identify some other patterns:
- In Madison two employers capture almost all commute flows: The UW-Madison downtown1 and electronic health record company Epic in suburban Verona. The only other employer making an appearance is the university hospital (which is a separate entity from the university)
- In Milwaukee, by far the state’s largest city, there are only three OD pairs in total: Two point at the 32-story Northwestern Mutual Tower downtown; the third leads to the large suburban medical campus that includes the Medical College of Wisconsin, Froedtert Hospital, and the Childrens’ Hospital of Wisconsin.
- Sheboygan is probably best known for plumbing product company Kohler, and the Kohler Co. headquarters make a prominent appearance on the map, with 8 arcs pointing at it.
- For the remainder of OD pairs around the state, it’s primarily meat processing, healthcare facilities, and tribal facilities that appear as destinations.
- For two OD pairs, home and work are actually in the same block: One is the UW in Platteville (presumably students living and working on campus), and a strangely empty looking wooded block near Hayward. My best guess is that it’s a farm or forestry business.
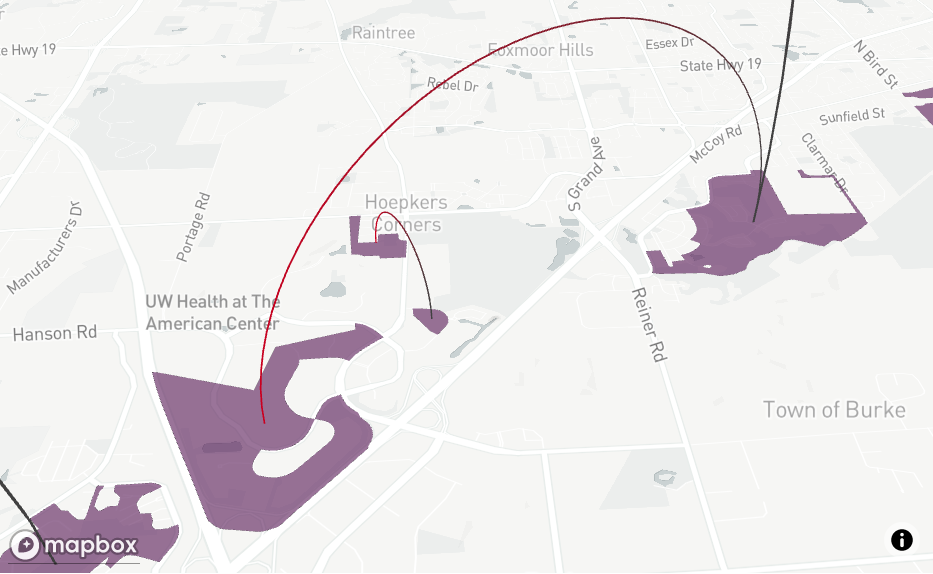
Madison flows
Given the visual prominence of Madison on the map (and my personal interest in Madison), it makes sense to do a separate analysis just for flows within Dane County.
Well, this doesn’t look all that different, does it? More arcs, but all of them still point at the UW, Epic, and the university hospital. This doesn’t change even if you look at the top-150 OD pairs. Only once you bump it up to 300, a few more work locations appear.
[1] "550250011021004" "550250108003008" "550250032001008"
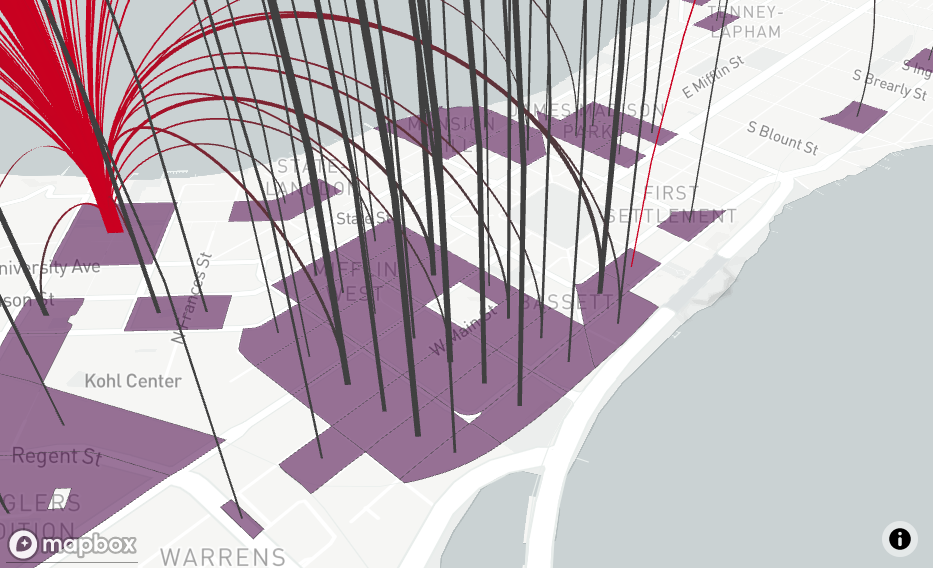
[4] "550250114022021" "550250114022035" "550250017042003"Plotting 300 arcs of course is a bit of a mess:
If you scroll around enough you see the City-County Building, American Family Insurance, and a block with several employers near the Am Fam campus.
Some observations:
- There are about 20 contiguous blocks in the Bassett and Mifflin neighborhood that have a lot of people commuting to Epic. That area is well served by the 75 bus providing peak-hour service to and from Epic in 35 to 40 minutes
- There are surprisingly few commute blocks on the east side. For Epic employees that makes sense, as traveling through the isthmus takes a good amount of time, but I would have expected more prominent UW flows
Aggregating to block groups
I mentioned at the beginning of the article that census blocks tend to be fairly small. What happens when we aggregate them into block groups?
With the cut-off set to the 100 most frequent OD pairs, a few additional employment centers make an appearance, along the Beltline in Middleton. Other than that, there is not much insight to be gained. And especially along the edges of town, the block groups are quite large. If, for example, your goal is transit planning, using blocks is probably the better choice.
Conclusion
This is my first time extensively working with LODES origin-destination data and I have learned a lot in terms of data prep and visualization. In terms of actual insights, I am a bit disappointed. Everything being so centered on the UW and Epic leaves little opportunity to learn about other employment centers. But maybe the realization just how dominant these employers are in terms of commute flows is a valuable insight in itself. How, for example, could all those Epic employees on the west side of Madison and in Middleton be better served by transit? And why do Epic employees seemingly cluster more in where they live? The trope of “Epic luxury apartments” downtown is well known—and appears to have some truth to it.
For some reason, the university reports all(?) of its employees as working at a single location. In reality, UW employment is more spread out.↩︎