I regularly post about transit data, here and on social media–often about ridership for our local transit agency, Madison Metro. Those posts have always been based on data from National Transit Database (NTD). But I kept encountering discrepancies in the ridership data: I saw one number in the NTD spreadsheets and another number mentioned in, say, a local press conference. When I asked Metro about this, they mentioned that they were aware of possible data issues, but it wasn’t clear whether those were related to NTD. In this post, I dig deeper in what we can learn from looking at NTD reporting over time.
There are two types of monthly time series data available from NTD: “adjusted” and “raw” data. I spent a good amount of time trying to find out what exactly NTD mean by adjusted data. On their download page they say this (emphasis mine):
“Contains monthly-updated service information reported by urban Full Reporters, released after adjustments.
This file will be updated periodically by FTA to include data for subsequent months, and to incorporate revisions to prior months in the calendar year made by the transit properties. In some cases, this may include revisions to data from previous years.
Any data value that appears in this file that does not appear in the Raw Database Time Series is based on a growth estimate developed by FTA. The strength of each estimate improves when the population of agencies reporting in the prior period is larger. ”
A PowerPoint presentation on using NTD data, states that “Adjusted Monthly Module Data Release Is Adjusted to Support Time-Series Study.” And cautions, “Data from the most-recent Month may be incomplete due to late reporters. Data is subject to change for up to 18 months (or more in rare cases).”
None of this is very helpful in understanding how the data are being adjusted. For an agency like Madison Metro, which as a full reporter is required to report data monthly, it would seem to make sense to just use the raw data. Let’s compare raw and adjusted:
Show code
library(tidyverse)
library(ntdr) #install with remotes::install_github("https://github.com/vgXhc/ntdr")
ggplot2::theme_set(theme_minimal())
metro_raw <- get_ntd(agency = "City of Madison", data_type = "raw", modes = "MB", cache = TRUE)
metro_adjusted <- get_ntd(agency = "City of Madison", data_type = "adjusted", modes = "MB", cache = TRUE)

metro_raw <- metro_raw |>
  mutate(data_type = "raw")
metro_adjusted <- metro_adjusted |>
  mutate(data_type = "adjusted")

metro_all <- rbind(metro_raw, metro_adjusted)

ggplot(metro_all, aes(month, value, color = data_type)) +
  geom_line(alpha = .5) +
  labs(title = "Madison Metro monthly ridership") +
  ylab("Unlinked passenger trips")
We see that the raw data is not available for the most recent year. Here’s what the ReadMe tab of the raw data release says:
The Monthly module includes a limited set of key indicators reported by transit properties. Data is reported on a monthly basis, by mode and type of service, for a fiscal year.
And further down: “Unlinked Passenger Trips – For the most recent closed-out annual report year.” So the raw data only seem to be made available after a full year has been closed out. This is really confusing.
Back to the adjusted data. Because I’m really bad at cleaning out my “Downloads” folder, I have several monthly adjusted data files released in different months in 2022. This gives us the ability to compare the files and see how large the adjustments being made actually are. Let’s compare data released for1 March, October, and December of 2022.
Show code
library(readxl)
bus_dec_22 <- read_excel("c:/Users/user1/Downloads/December 2022 Adjusted Database(1).xlsx", sheet = 3)

bus_oct_22 <- read_excel("C:/Users/user1/Downloads/October 2022 Adjusted Database(1).xlsx", sheet = 3)

bus_mar_22 <- read_excel("c:/Users/user1/Downloads/March 2022 Adjusted Database.xlsx", sheet = 3)

bus_long_dec_22 <- bus_dec_22 %>%
  filter(Agency == "City of Madison" & Modes == "MB") |>
  pivot_longer(cols = 10:ncol(bus_dec_22), names_to = "month", values_to = "value") %>%
  mutate(date = my(month),
         month = month(date),
         report_month = "dec_22")


bus_long_mar_22 <- bus_mar_22 %>%
  filter(Agency == "City of Madison" & Modes == "MB") |>
  pivot_longer(cols = 10:ncol(bus_mar_22), names_to = "month", values_to = "value") %>%
  mutate(date = my(month),
         month = month(date),
         report_month = "mar_22")

bus_long_oct_22 <- bus_oct_22 %>%
  filter(Agency == "City of Madison" & Modes == "MB") |>
  pivot_longer(cols = 10:ncol(bus_oct_22), names_to = "month", values_to = "value") %>%
  mutate(date = my(month),
         month = month(date),
         report_month = "oct_22")

metro_comp <- rbind(bus_long_dec_22, bus_long_oct_22, bus_long_mar_22)

metro_comp|>
  ggplot(aes(date, value, color = report_month)) +
  geom_line() +
  scale_color_discrete("Data release") +
  ylab("Unlinked passenger trips") +
  labs(title = "Comparing NTD monthly adjusted data releases")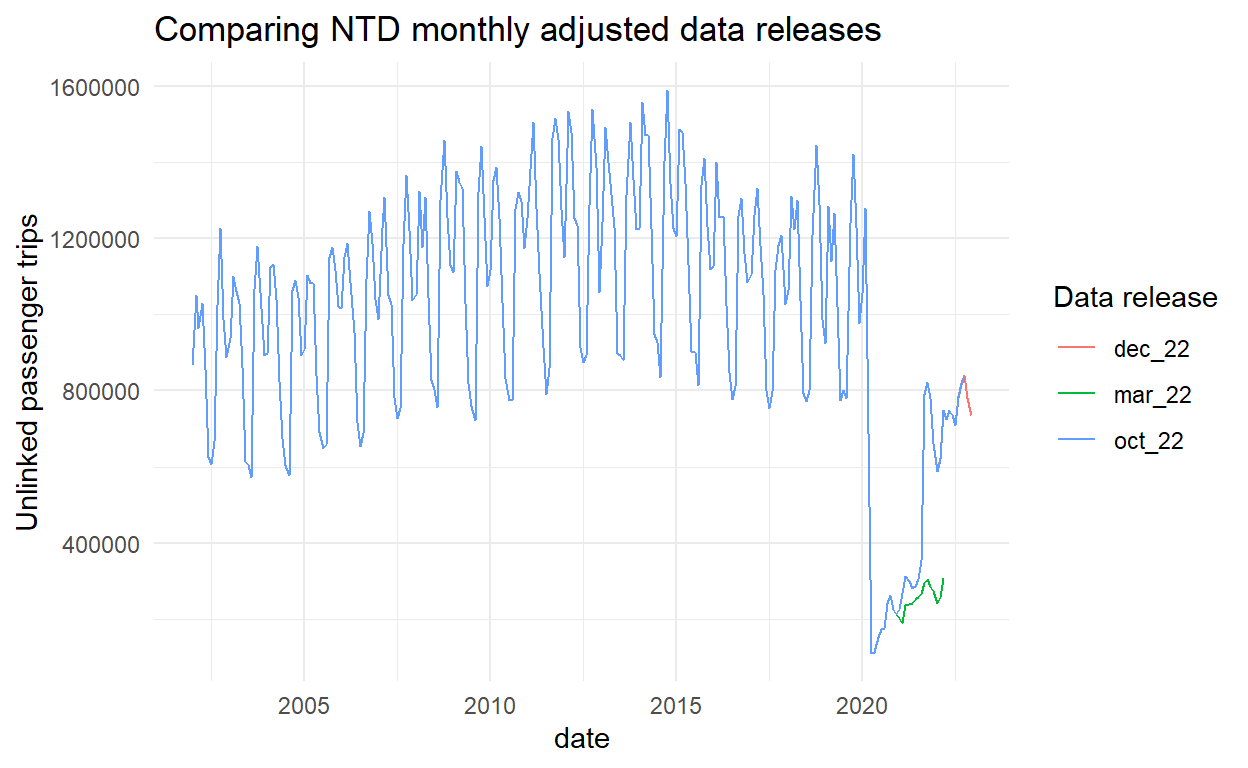
The three lines overlap nicely for any data prior to about 2020. Let’s zoom in on the more recent data:
Show code

The most obvious discrepancy is between the data released for March 2022 and the October and December releases: The March release starts diverging in January 2021 and is much lower, especially in the second half of 2021. The October and December releases appear quite similar, but if you squint, you can see small differences.
We can calculate and plot these differences:
Show code
metro_comp |>
  pivot_wider(names_from = "report_month", values_from = "value") |>
  mutate(diff_mar_oct = mar_22 - oct_22,
         diff_mar_dec = mar_22 - dec_22,
         diff_oct_dec = oct_22- dec_22) |>
  pivot_longer(cols = starts_with("diff_"), names_to = "report_date", values_to = "difference") |>
  filter(report_date == "diff_oct_dec" & date > ymd("2020-01-01")) |>
  ggplot(aes(date, difference)) +
  geom_col() +
  labs(title = "Ridership difference December and October 2022 NTD releases") +
  ylab("Unlinked passenger trip difference")
Yes, there are differences for 2022, but the differences are fairly small compared to overall ridership.
Conclusion
Adjusted monthly NTD data is indeed adjusted from one month to another. Whether that adjustment is because of data revisions from the reporting agency or something that FTA does (or both) is unclear. The adjustments affect primarily the most recent data, and they can be large or small. It is possible that the COVID shock to ridership had an outsize influence on the adjustments being made. These conclusions are based on my looking at the data for one specific agency; I cannot say if they hold true for other transit agencies. I also only look at ridership data. The monthly NTD releases also include vehicle revenue miles, vehicle revenue hours, and some other metrics.
Personally, I will be much more cautious with current-year data and either not report on it all or at least add more cautionary language about data quality. It’d be great if our local transit agency made their raw data reported to FTA available on the City’s own open data portal.
I welcome feedback from others who know more about the NTD reporting and adjustment process.
There is a lag of about three months in publishing the data in the website. For example right now (April 6, 2023), the most recent data available is for January 2023.↩︎