The weather forecast for February 27 and 28 promised a wild temperature swing: From a record-scratching 67 F (19° C) on the 27th to a more seasonally appropriate low of 15 F (-9° C) the next day. Would this constitute the largest temperature swing ever recorded in Madison_ I already had some code to get the daily GHCN weather data (shout-out to JD Johnson and his Milwaukee weather graphs). Calculating the numbers and producing a chart was straightforward. First we get data from the Madison Truax location, which is the station with the longest-running temperature records, going back to 1939.
Show code
library(tidyverse)


# station readme
#   https://www1.ncdc.noaa.gov/pub/data/ghcn/daily/by_station/readme-by_station.txt

# # data readme
# #   https://www1.ncdc.noaa.gov/pub/data/ghcn/daily/readme.txt

# download the zipped file
temp <- tempfile()
download.file("https://www1.ncdc.noaa.gov/pub/data/ghcn/daily/by_station/USW00014837.csv.gz", temp)

# unzip and read
ghcn <- read_csv(temp,
  col_names = c(
    "id", "yearmoda", "element", "value",
    "mflag", "qflag", "sflag", "obs_time"
  ),
  col_types = "cccncccc"
)

# delete the zipped file
unlink(temp)

# subset and format
ghcn.wide <- ghcn %>%
  select(yearmoda, element, value) %>%
  filter(element %in% c("PRCP", "SNOW", "SNWD", "TMAX", "TMIN")) %>%
  separate(col = yearmoda, sep = c(4, 6), into = c("year", "month", "day")) %>%
  pivot_wider(names_from = element, values_from = value) %>%
  # convert from tenths of mm to inches
  mutate(
    PRCP = PRCP * 0.00393701,
    SNOW = SNOW * 0.00393701,
    SNWD = SNWD * 0.00393701
  ) %>%
  # convert from tenths of degrees C to F
  mutate(
    TMAX = ((TMAX / 10) * (9 / 5)) + 32,
    TMIN = ((TMIN / 10) * (9 / 5)) + 32
  ) %>%
  mutate(
    date = as.Date(paste(year, month, day, sep = "-")),
    day_of_year = case_when(
      lubridate::leap_year(date) & lubridate::yday(date) == 60 ~ NA_real_,
      lubridate::leap_year(date) & lubridate::yday(date) > 60 ~ lubridate::yday(date) - 1,
      TRUE ~ lubridate::yday(date)
    )
  ) %>%
  select(
    year, month, day, date, day_of_year, PRCP, SNOW, SNWD,
    TMAX, TMIN
  )
And now we calculate the relevant temperature difference and produce a chart:
Show code
ghcn.wide |>
  mutate(tmin_next_day = lead(TMIN)) |>
  mutate(max_min_diff = abs(TMAX - tmin_next_day)) |>
  arrange(desc(max_min_diff)) |>
  head(10) |>
  mutate(
    rank_diff = row_number(max_min_diff),
    mid_point = TMAX - ((TMAX - tmin_next_day) / 2),
    date_label = fct_reorder(as.factor(format(date, "%b %d, %Y")), rank_diff)
  ) |>
  select(date_label, TMAX, tmin_next_day, max_min_diff, rank_diff, mid_point) |>
  ggplot() +
  geom_segment(aes(x = date_label, xend = date_label, y = TMAX, yend = tmin_next_day)) +
  geom_point(aes(x = date_label, y = TMAX), color = "red") +
  geom_point(aes(x = date_label, y = tmin_next_day), color = "blue") +
  geom_text(aes(x = date_label, y = mid_point, label = round(max_min_diff, 0)), nudge_x = .4) +
  geom_text(aes(x = date_label, y = tmin_next_day, label = round(tmin_next_day, 0)), color = "blue", alpha = .3, nudge_y = -3) +
  geom_text(aes(x = date_label, y = TMAX, label = round(TMAX, 0)), color = "red", alpha = .3, nudge_y = 3) +
  coord_flip() +
  scale_y_continuous(name = "Temperature (F)") +
  xlab(element_blank()) +
  hrbrthemes::theme_ipsum_rc() +
  theme(
    panel.grid.major = element_blank(),
    panel.grid.minor = element_blank(),
    axis.text.x = element_blank()
  ) +
  labs(
    title = "Largest temperature swings in Madison, Wisconsin",
    subtitle = "Maximum temperature compared with next day's minimum temperature",
    caption = "Data: GHCN data for Madison Truax Airport (GHCND:USW00014837). Records begin on Jan 10, 1939.\nVisualization: Harald Kliems"
  )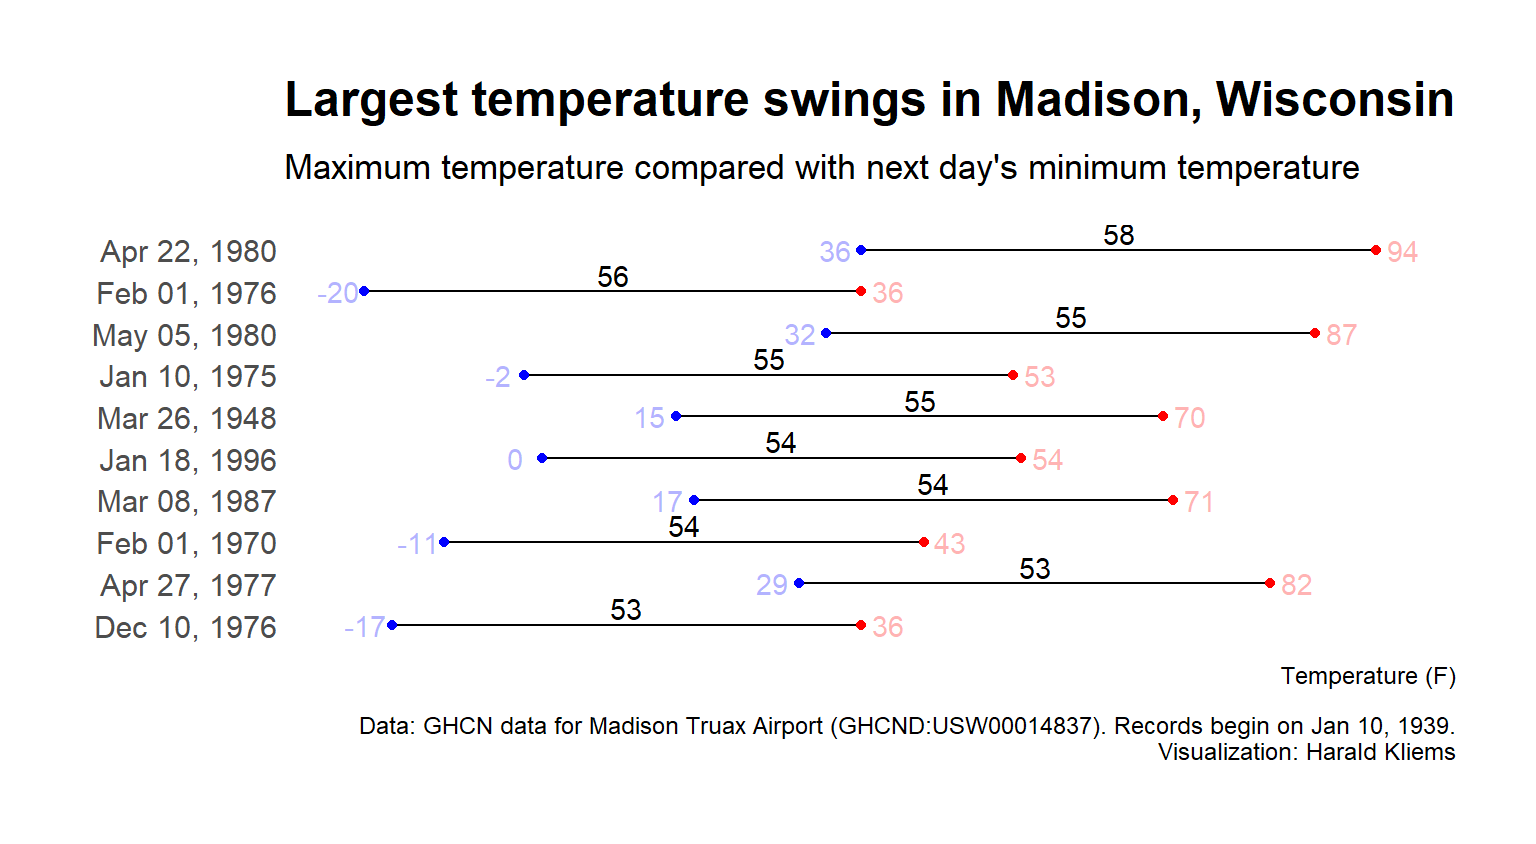
It’s February 28 now, and it’s very cold. And yesterday may have been warmer than initially predicted. GHCN records lag a few days behind, but I’ll certainly check back to see if we broke the top ten.