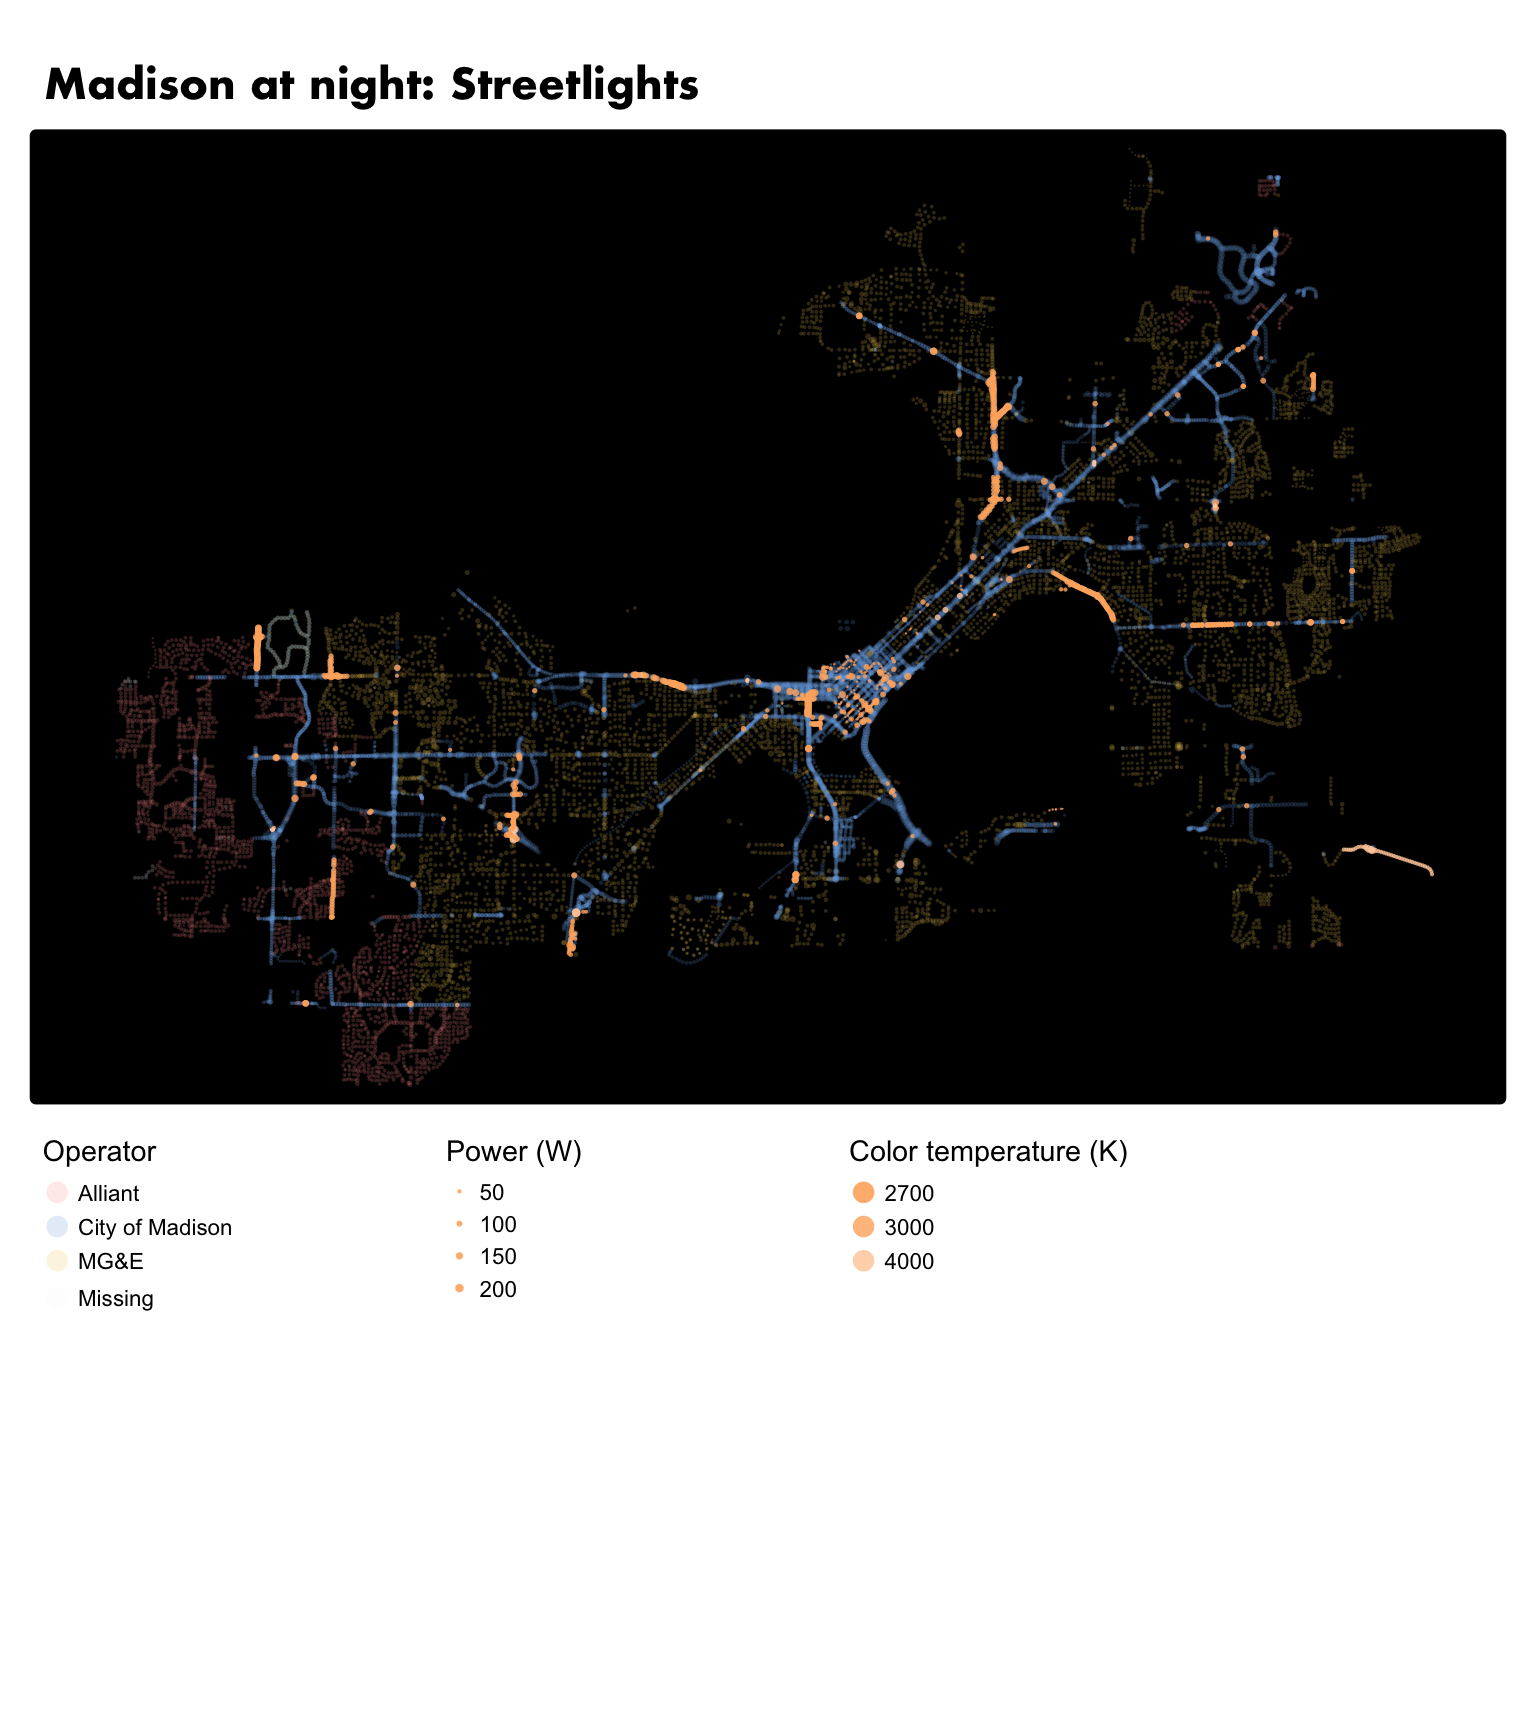
The day 5 theme of #30DayMapChallenge is sight. And what helps with sight at night? Streetlights!
In Madison, streetlights are operated either by the city or by one of the two utility companies serving the area. There are datasets for both on the city’s open data portal.
The variables available for city vs utility lights are not the same. For the city dataset, one interesting variable is the color temperature of the lights. The city has gradually replaced high pressure sodium lights with LED lights. LED lights are more efficient but early versions produced light with high color temperature, lookin blue-ish and potentially messing with human and animal night vision, circadian rhythms, and more. Another variable of interest is the Wattage of the lights. The wattage is available for all lights, in both datasets.
First we read in and combine the two datasets and reduce them to the common variables of interest. There are also a few lights far outside of city limits. We’ll remove those.
Show code
library(sf)
library(tidyverse)
library(tmap)
library(tigris)


city_lights <- st_read("data/City_Maintained_Street_Lights_-_Luminaire.geojson")
utility_lights <- st_read("data/Utility_Maintained_Street_Lights.geojson")

madison <- places(state = 55, cb = TRUE) |>
  filter(NAME == "Madison") |>
  st_transform(crs = st_crs(city_lights))

lights <- city_lights |>
  select(Color_Temp, Wattage) |>
  mutate(operator = "City of Madison",
             Color_Temp = as.factor(str_remove(Color_Temp, "K"))) |>
  rbind(
    utility_lights |>
  rename(Wattage = Watt2,
         operator = Utility) |>
  mutate(Color_Temp = NA) |>
  select(Color_Temp, Wattage, operator)
  ) |>
  st_filter(madison)

glimpse(lights)
Before we make the map, there are a few intermediate steps: I wanted to show the lights that have a color temperature value in the actual color that they have. This requires converting the color temperature to an RGB value with the “Tanner Helland approximation”.
Show code
city_lights |>
  filter(!is.na(Color_Temp)) |>
  mutate(
    T = as.numeric(str_remove(Color_Temp, "K")) / 100,
    R = if_else(T <= 66,
                255,
                329.698727446 * (T - 60)^(-0.1332047592)),
    G = if_else(
      T <= 66,
      99.4708025861 * log(T) - 161.1195681661,
      288.1221695283 * (T - 60)^(-0.0755148492)
    ),
    B = case_when(
      T <= 19 ~ 0,
      T > 10 &
        T < 66 ~ 138.5177312231 * log(T - 10) - 305.0447927307,
      T >= 66 ~ 255
    ),
    hex = rgb(
      red = R,
      green = G,
      blue = B,
      maxColorValue = 255
    )
  ) |>
  distinct(Color_Temp, hex)
Color_Temp hex
1 2700K #FFA657
2 3000K #FFB16D
3 4000K #FFCDA6The dataset only has three different light temperatures. Now we can combine this all into one pretty map, with size representing wattage, and the color either showing the color temperature, when available, or the operator otherwise.
Show code
tmap_mode("plot")
tm_shape(lights |> filter(is.na(Color_Temp))) +
  tm_bubbles(
    fill = "operator",
    col = "white",
    lwd = 0,
    fill_alpha = .2,
    fill.legend = tm_legend(title = "Operator"),
    size = "Wattage",
    size.scale = tm_scale(values.scale = .3),
    size.legend = tm_legend(show = FALSE)
  ) +
  tm_shape(lights |> filter(!is.na(Color_Temp))) +
  tm_bubbles(
    fill = "Color_Temp",
    fill.legend = tm_legend(title = "Color temperature (K)"),
    fill.scale = tm_scale_categorical(
      values = c(
        "2700" = "#FFA657",
        "3000" = "#FFB16D",
        "4000" = "#FFCDA6"
      ),
      value.na = "white"
    ),
    fill_alpha = .8,
    size = "Wattage",
    size.legend = tm_legend(title = "Power (W)"),
    size.scale = tm_scale(values.scale = .3),
    col = "white",
    lwd = 0
  ) +
  tm_title(text = "Madison at night: Streetlights",
           fontface = "bold",
           fontfamily = "Futura") +
  tm_options(
    bg = TRUE,
    bg.color = "black",
    legend.position = tm_pos_out("center", "bottom"),
    legend.stack = "horizontal",
    legend.width = 15,
    legend.frame.lwd = 0
  ) +
  tm_layout(outer.margins = c(.02, .02, .02, .02), asp = 0)